Analyse scrap trends and waste
What this does
Turns the scrap register into a trend: how much material is being written off, of what, and out of which part of the operation — so waste becomes a number you can act on instead of an impression. The screen that does it is Scrap Orders itself, in its graph and pivot views; there is no separate scrap report.
See also
Scrap damaged stock covers raising and validating a scrap order, and Account for scrapped goods covers what a validated scrap does to your books. This article is about reading the accumulated record.
Before you start
- Analysis is only as good as the recording. Scrap raised weeks late, or not at all, produces a report that flatters the factory — and a database where nobody has raised one yet produces an empty graph, not a zero waste rate.
- The graph and the pivot on this screen ship with nothing configured. Neither has a saved layout, so you build the analysis by hand each time you open it, or you save it as a favourite once you have it right.
- Decide what you want to compare before you open it. Material, period, source location and reason each answer a different question, and only some of them are available without switching a setting on.
Steps
-
01
Open Inventory › Operations › Adjustments › Scrap.
-
02
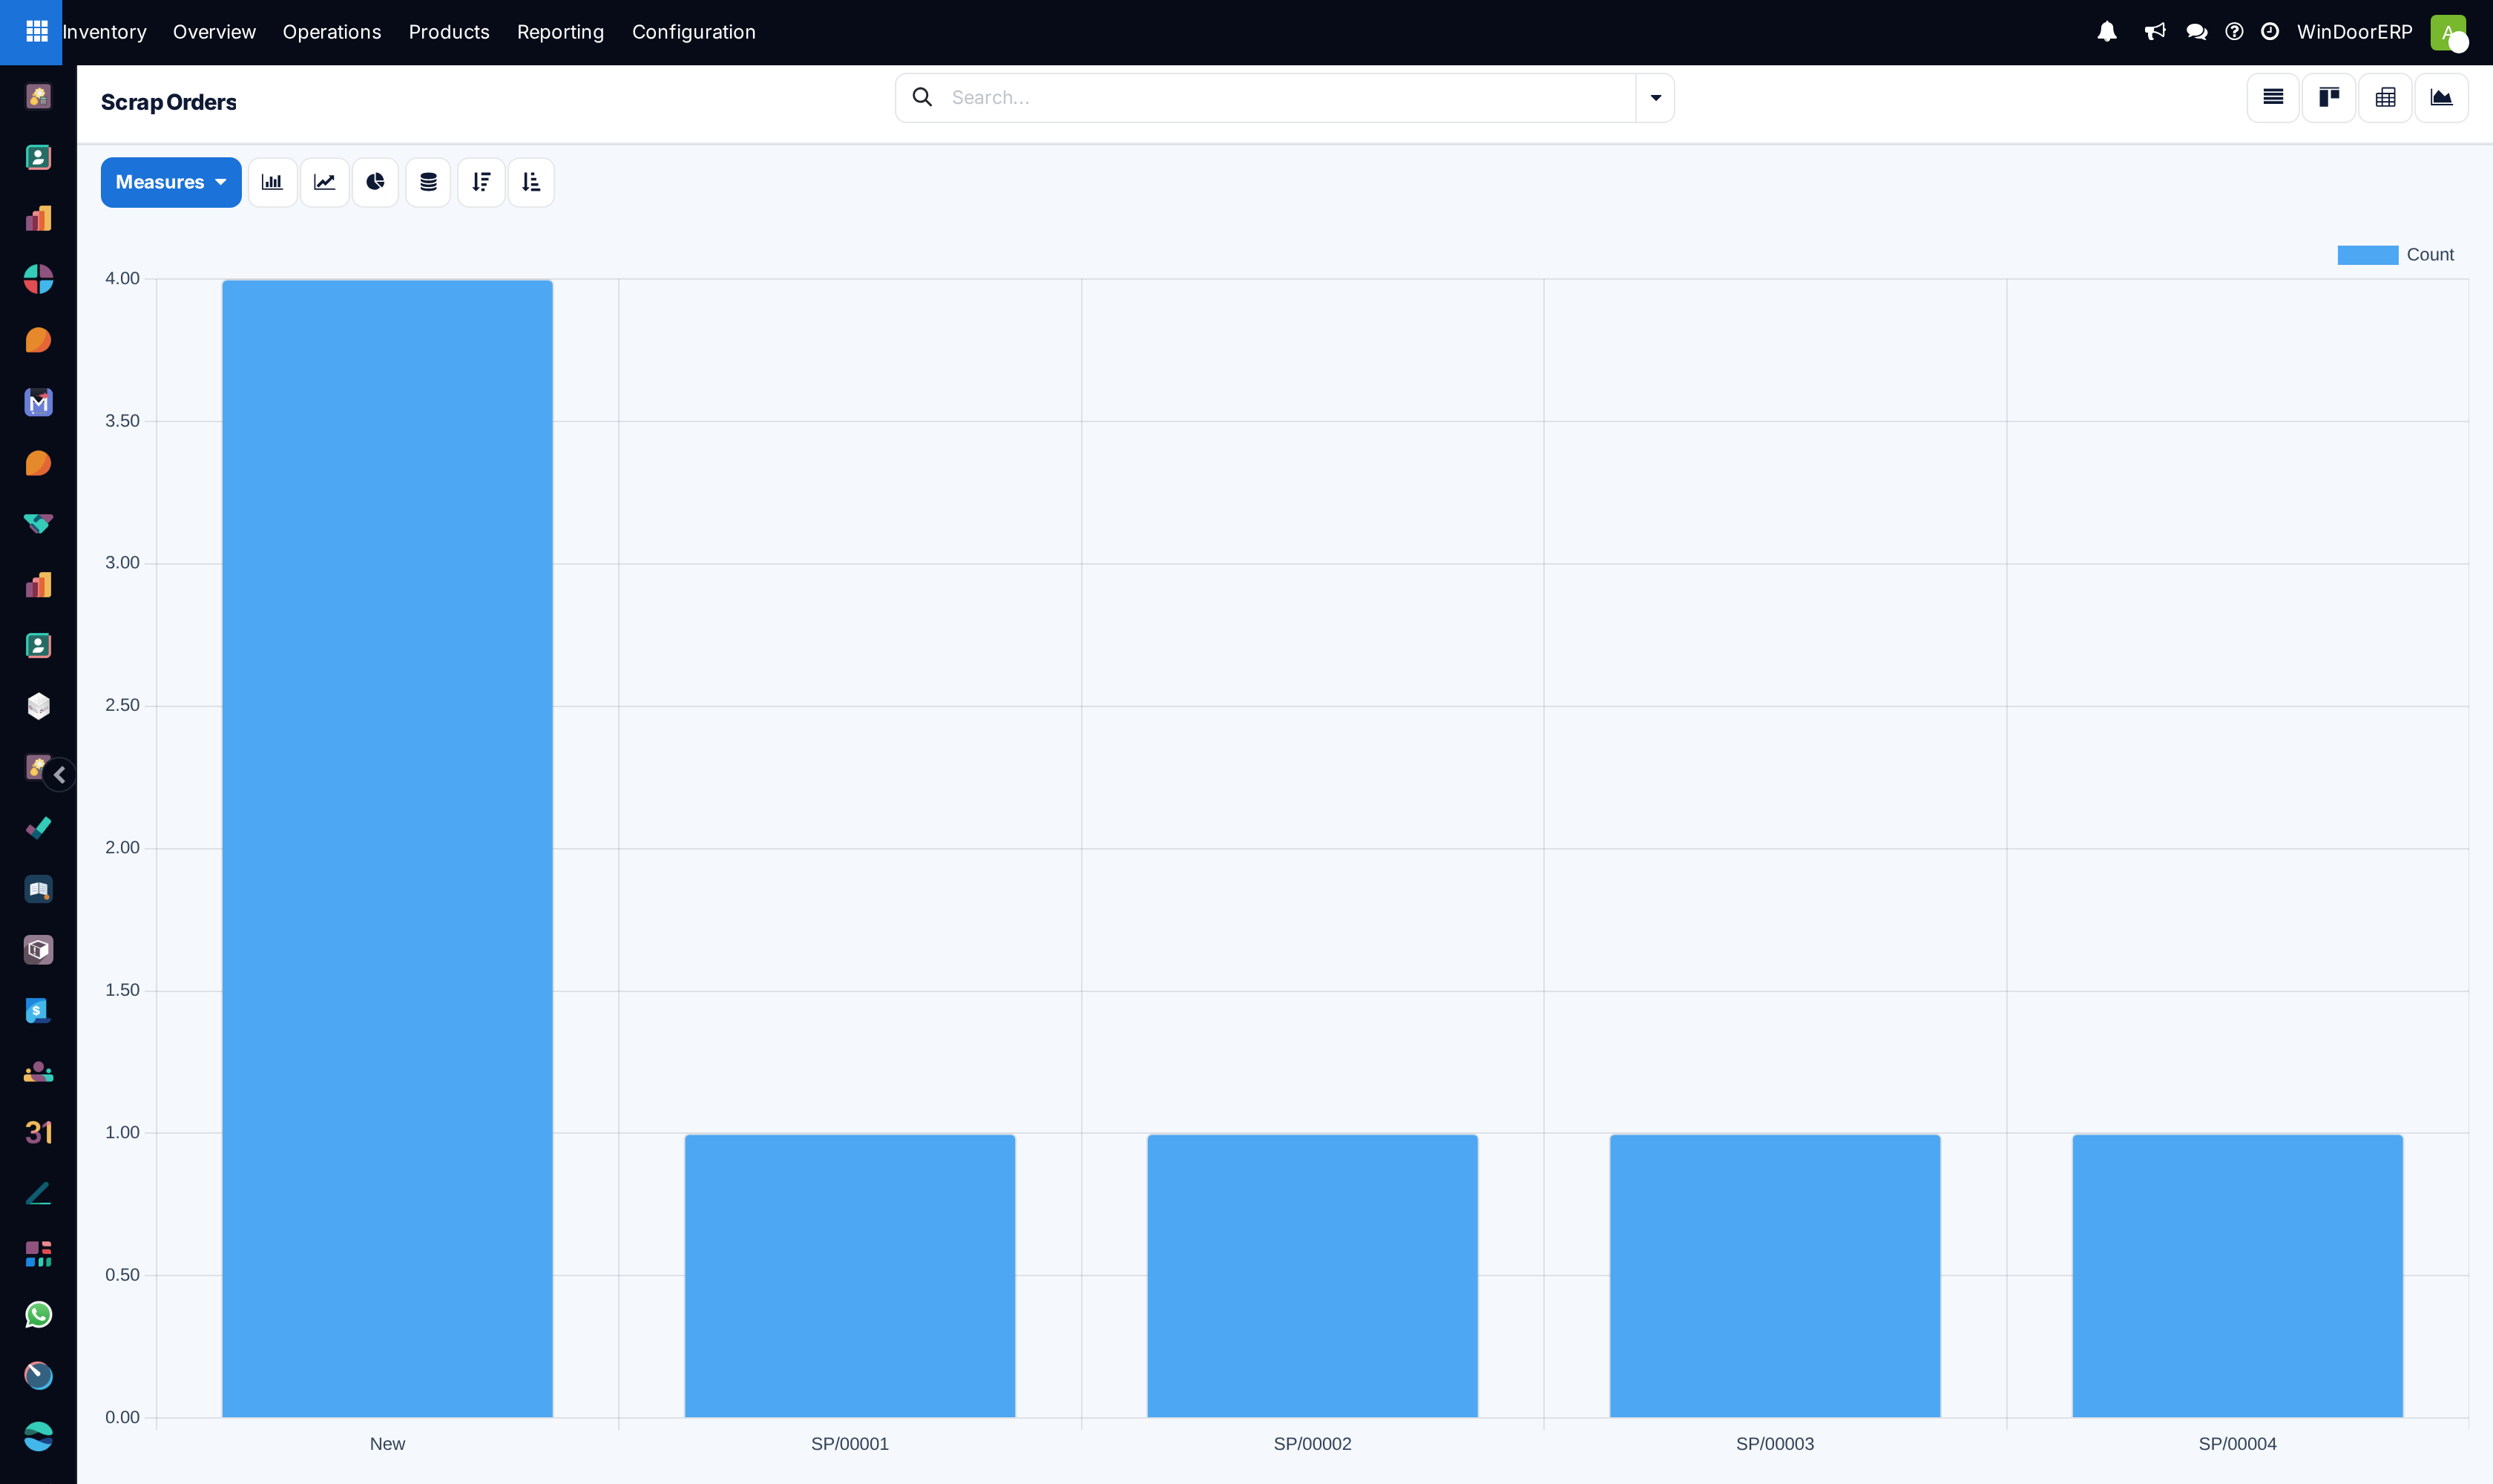
Switch to the Graph view. It opens as a bar chart of Count by Reference, which tells you nothing — open Measures and choose Quantity, then click the axis label and regroup by Product or by Date.
-
03
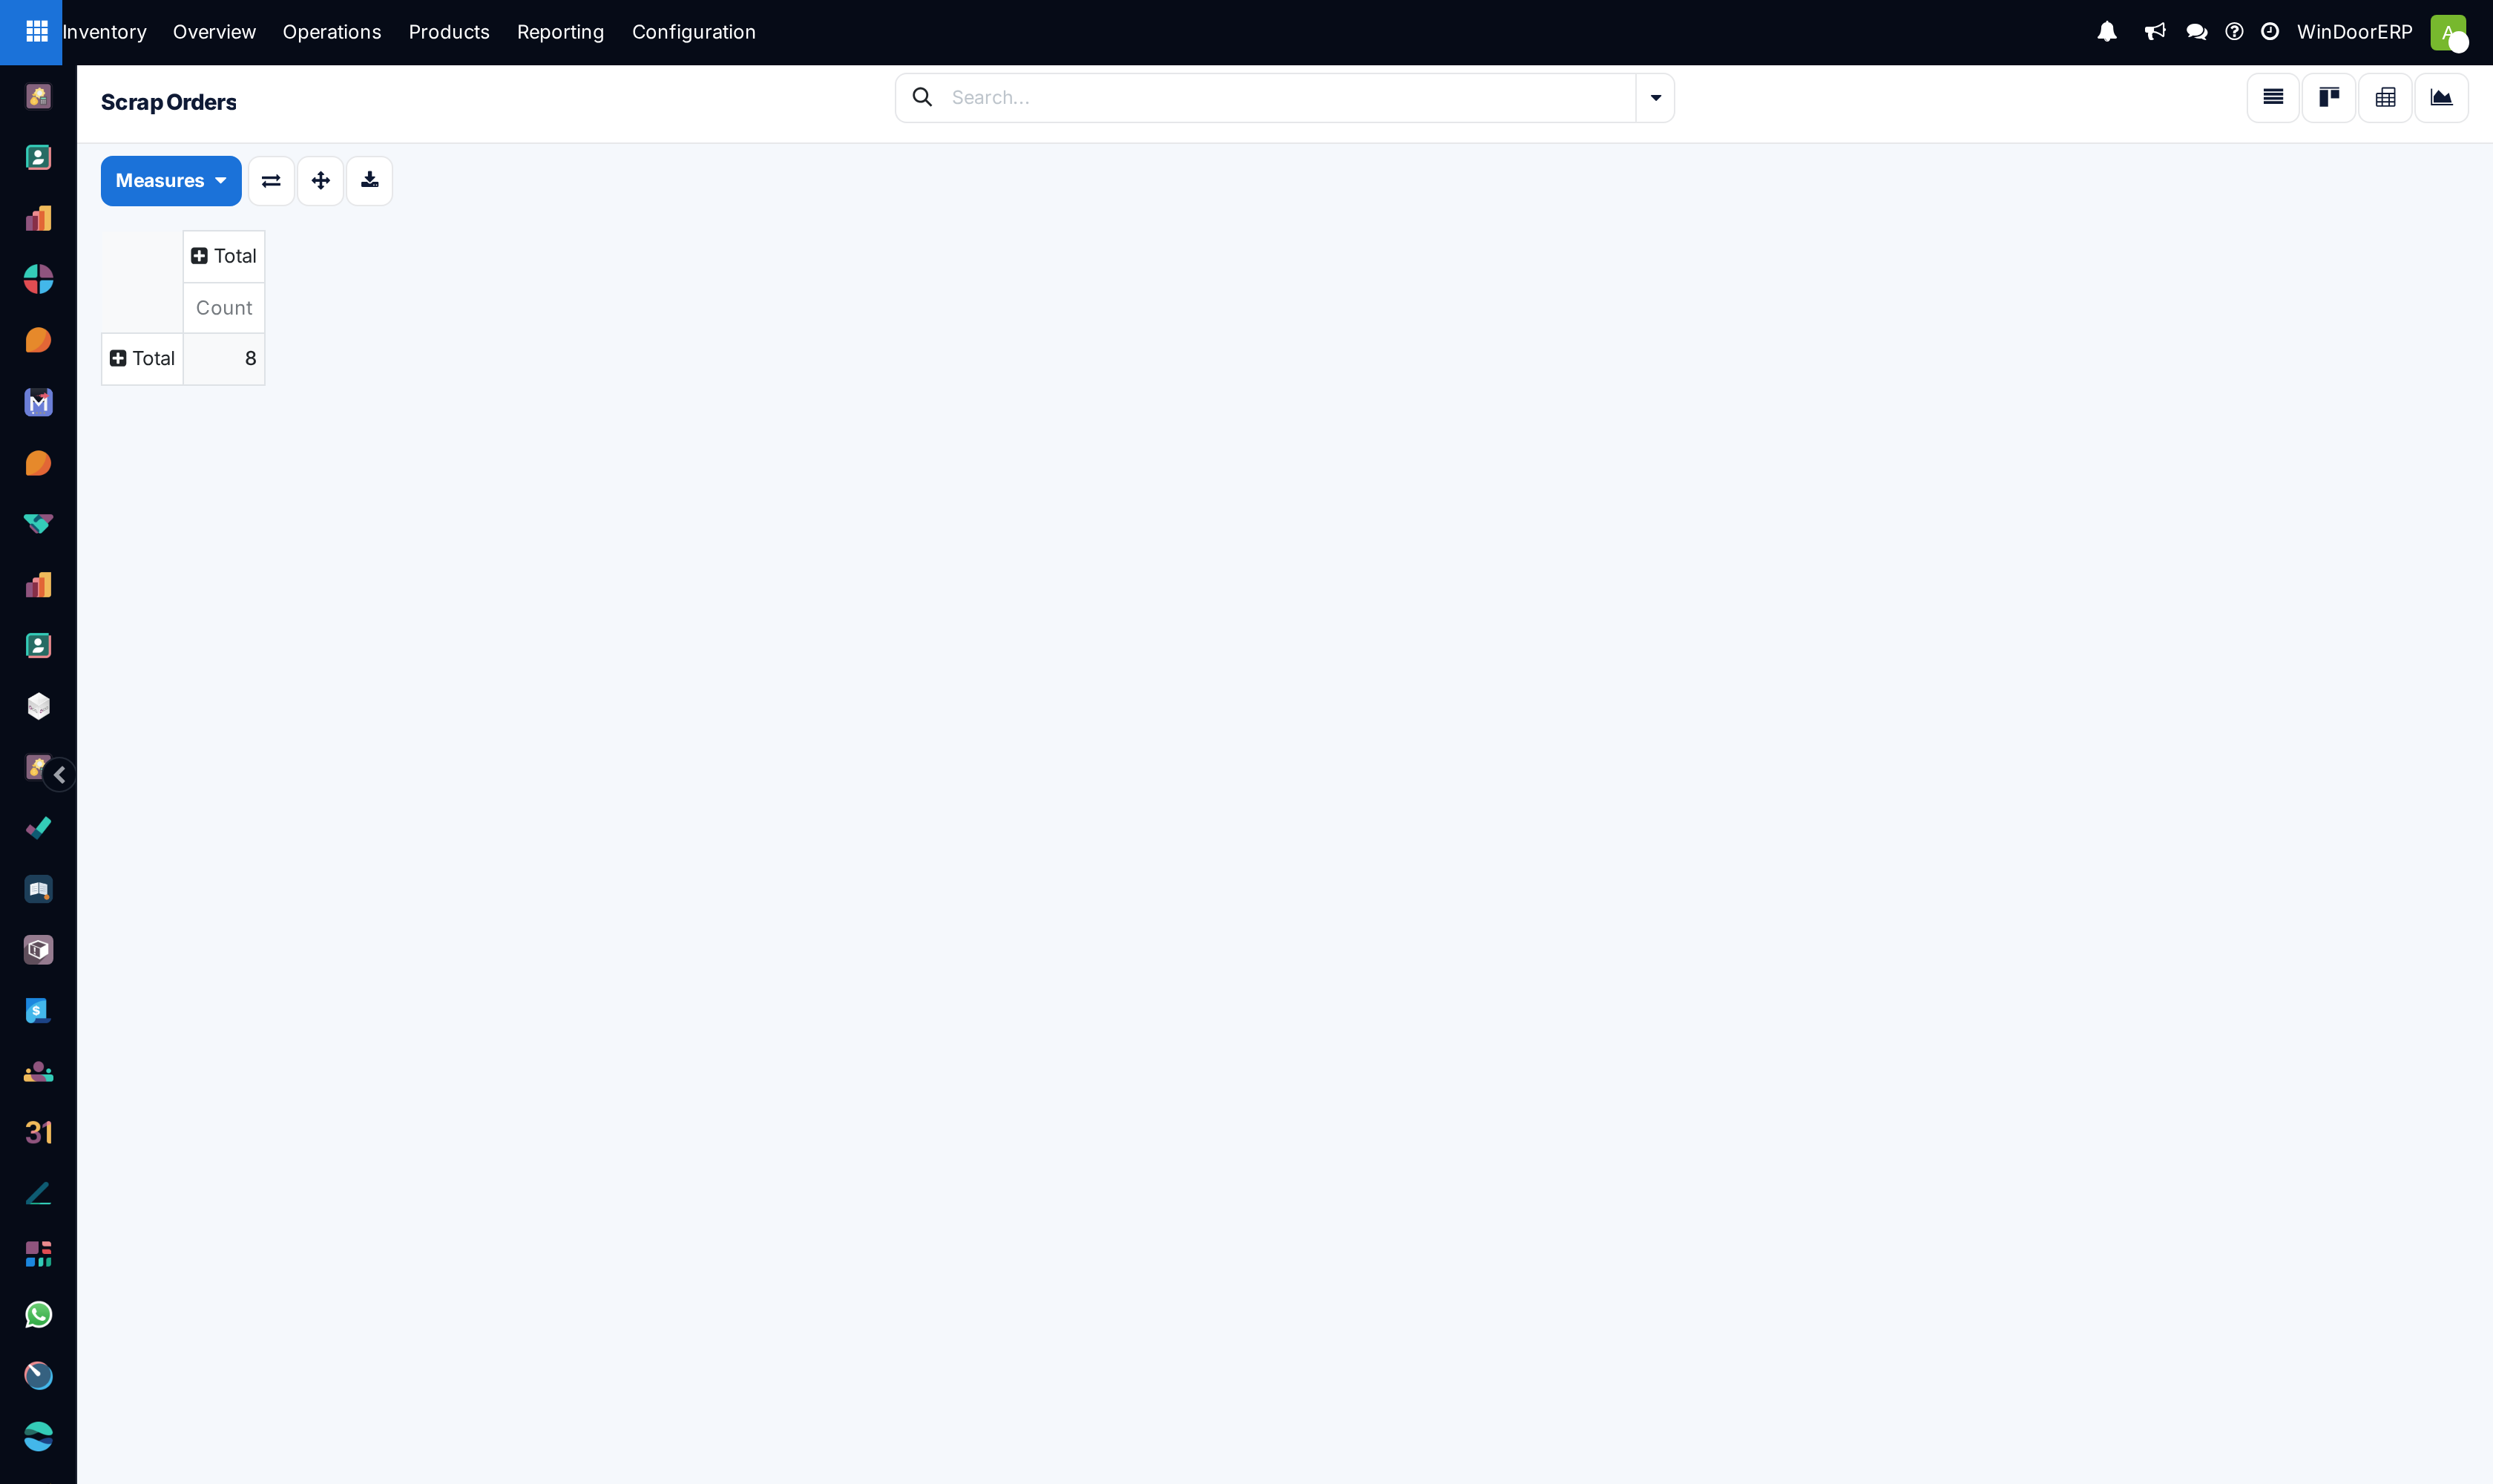
Switch to the Pivot view. It opens as a single Total / Count cell — expand the row header by Product, the column header by Date, and add the Quantity measure.
-
04
Use Group By in the search panel for the ready-made groupings: Product, Location, Scrap Location and Transfer. For anything else — a period, or the status — pick the field from the Custom Group list at the bottom of the same menu.
-
05
Save the arrangement under Favorites so the next person opens the analysis rather than rebuilding it.
Why the first screen is always disappointing
Both figures above are the untouched defaults, and they are worth showing because the surprise costs people time. The graph groups by Reference, so every scrap order that has not been validated yet — they are all still called New until validation gives them their SP/ number — collapses into one tall bar that means "how many drafts are lying about", not "how much was scrapped". The pivot has no measure and no grouping at all.
Two things follow. First, always set the measure to Quantity before you read anything: Count counts scrap orders, and one order for 40 m² of glass counts the same as one order for a single handle. Second, there is no Done filter anywhere in this screen's search panel, so drafts are mixed into every figure until you exclude them yourself — group by Status through Custom Group, or read the list view where drafts are shown in a distinct colour and carry no date.
What you can classify scrap by
| Classifier | What it gives you, and what it costs |
|---|---|
| Product | Always available, always meaningful. The default first cut. |
| Scrap Reason | Free-form tags on the scrap order. Nothing ships as standard and there is no configuration menu for them: you create one by typing a new name into the Scrap Reason field on a scrap order and confirming it. Names are unique — a repeat is refused with "Tag name already exists!". Anyone on the Inventory User level can add and rename them; only an Administrator can delete one. |
| Source Location (the Location grouping) | Where the material was when it was written off — cutting, glazing and the delivery bay generate different kinds of loss. The column and the field are hidden unless Storage Locations is switched on, but the grouping in the search panel works either way. |
| Scrap Location | Where it went. On this platform the operating company has exactly one inventory-loss location, Inventory adjustment, so this grouping produces a single bucket and scrap is pooled with stock-count corrections. |
| Transfer | The receipt, delivery or internal transfer the scrap was raised from, when it was raised from the gear menu of an operation rather than from scratch. |
| Date | The validation date, not the date the damage happened. It is empty on drafts, and it is not offered in Group By — add it through Custom Group, or use it as the column axis in the pivot. |
Important
Because every scrap goes to the same inventory-loss location, waste and count corrections land in one bucket and no grouping can separate them afterwards. If you want them apart in reporting, create a dedicated location with the type Inventory Loss and set it as the Scrap Location on the scrap order — and note that this decision has to be made before the data accumulates, not after.
Finding out what the waste cost
No view on this screen reports value: the measures on offer are Quantity and Count, and the scrap order form has no money on it anywhere. The figure does exist, though, one screen away. Validating a scrap creates an ordinary outgoing stock move to the loss location, and because it leaves your stock it is valued like any other outgoing move.
So: open Inventory › Reporting › Moves Analysis, type SP/ into the search box as a Reference, switch on the hidden Value column, and you have the cost of every scrap on the system. Analyse stock moves and their values explains what that value is built from. What you will not find is a journal entry: with the periodic valuation this platform uses, validating a scrap posts nothing to the general ledger — the write-off only shows up when stock is closed. That is the subject of Account for scrapped goods.
Turning it into a rate
A quantity alone does not say whether waste is rising: ten square metres in a busy month and in a quiet one are different results. Compare scrap against the volume that produced it — the units delivered, or the material consumed in the same period, both readable from Moves Analysis — and track that ratio rather than the raw number. And check that recording discipline was comparable in the two periods before you compare them at all, because an improvement in the chart is just as easily a decline in reporting.
Troubleshooting
| Symptom | Cause and fix |
|---|---|
| The graph is a row of bars labelled SP/00001, SP/00002… | That is the untouched default: Count by Reference. Set the measure to Quantity and regroup by Product or Date. |
| One enormous bar labelled New | Every scrap order that has not been validated is still called New, so they all group together. Validate them, or exclude drafts by status. |
| The pivot is a single cell | Also the default — the pivot ships with no measure and no grouping. Expand the headers and add the Quantity measure. |
| There is no Done filter | Correct, this screen has none. Group by Status through Custom Group to separate drafts from confirmed write-offs. |
| Everything groups under one location | All scrap goes to the company's single inventory-loss location. Create dedicated ones if you need the split. |
| Scrap Reason is empty on every order | None ship with the system; they are yours to define, by typing them on a scrap order. Until they are in use, group by product or location instead. |
| No Source Location column | It needs Storage Locations, which is off on this platform. The Location grouping still works. |
| You cannot find a value figure | There is none on this screen. Read it off Moves Analysis with the Value column switched on, as described above. |
| A spike traces to one document | Click through to the scrap order and its Source Document — a single mis-cut batch can distort a month. |
Common mistakes
- Reading Count and calling it waste. One scrap order is not one unit of loss.
- Reporting a raw scrap quantity with no denominator, so nobody can tell whether it is good or bad.
- Letting reason tags proliferate until every scrap carries a unique label and grouping is meaningless.
- Treating the report as a performance score for the shop floor — the fastest way to stop people recording scrap at all.
- Comparing months without checking that recording discipline was the same in both.
Was this article helpful?
Thanks — your feedback helps.
Running a window or door factory?
Ask for a demo