Trace every movement of a product
What this does
Two sibling reports give a product's full paper trail. Inventory › Reporting › Moves History is the fine-grained one — one line per move line, exactly what physically went from where to where, when, by whom — and the screen to answer "trace every movement of this product". Moves Analysis is its planning-level sibling: one line per stock move, demand versus done quantity — and the only reporting list with per-move Value columns.
Before you start
- The Inventory Manager role — the whole Reporting menu is manager-gated.
- Both screens are read-only trails: records exist because operations were validated, and neither list can create anything.
Steps
-
01
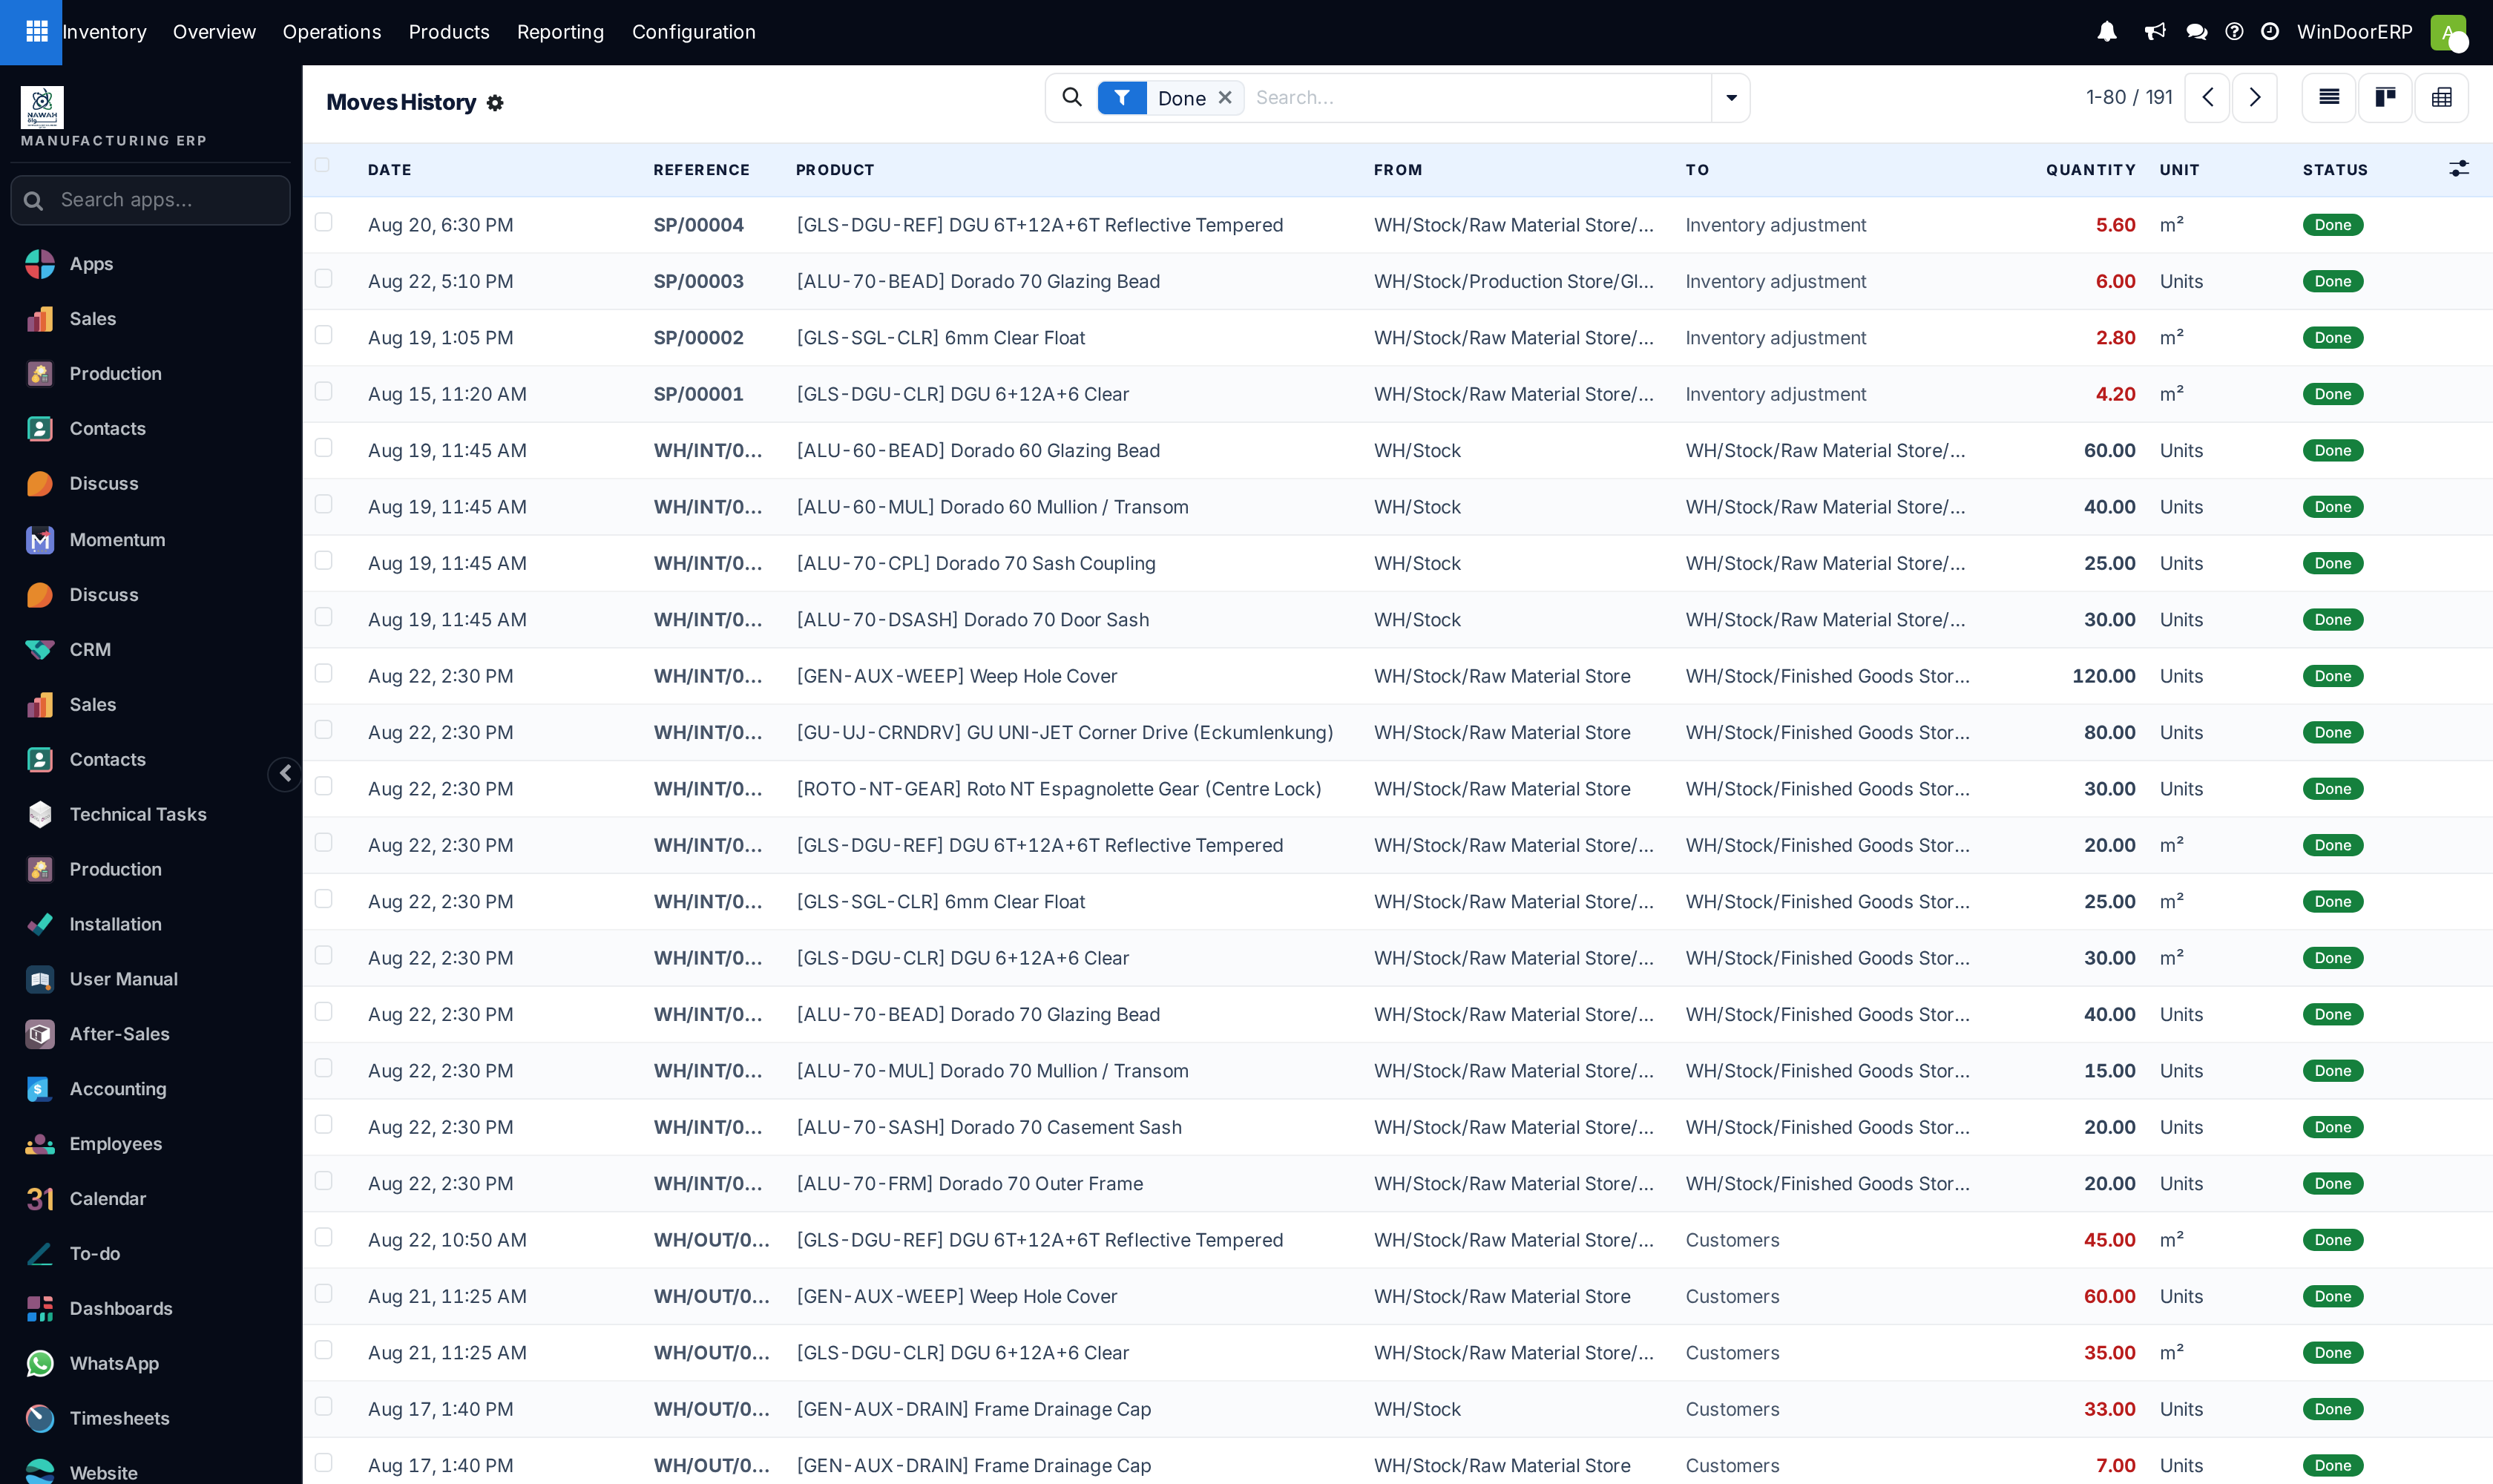
Open Inventory › Reporting › Moves History. It opens filtered to Done — the things that actually happened, newest first.
-
02
Search the product. That plus the Done filter is the product's movement trace. (The shortcut: the Stock report's per-row History button lands here pre-filtered.)
-
03
Read a line: date, the Reference (colour-coded — green receipts, blue deliveries, orange adjustments, red scraps), product, From and To, and the quantity, red when it left internal stock and green when it entered.
-
04
Click a line to open the document behind it — the transfer, adjustment or scrap itself.
-
05
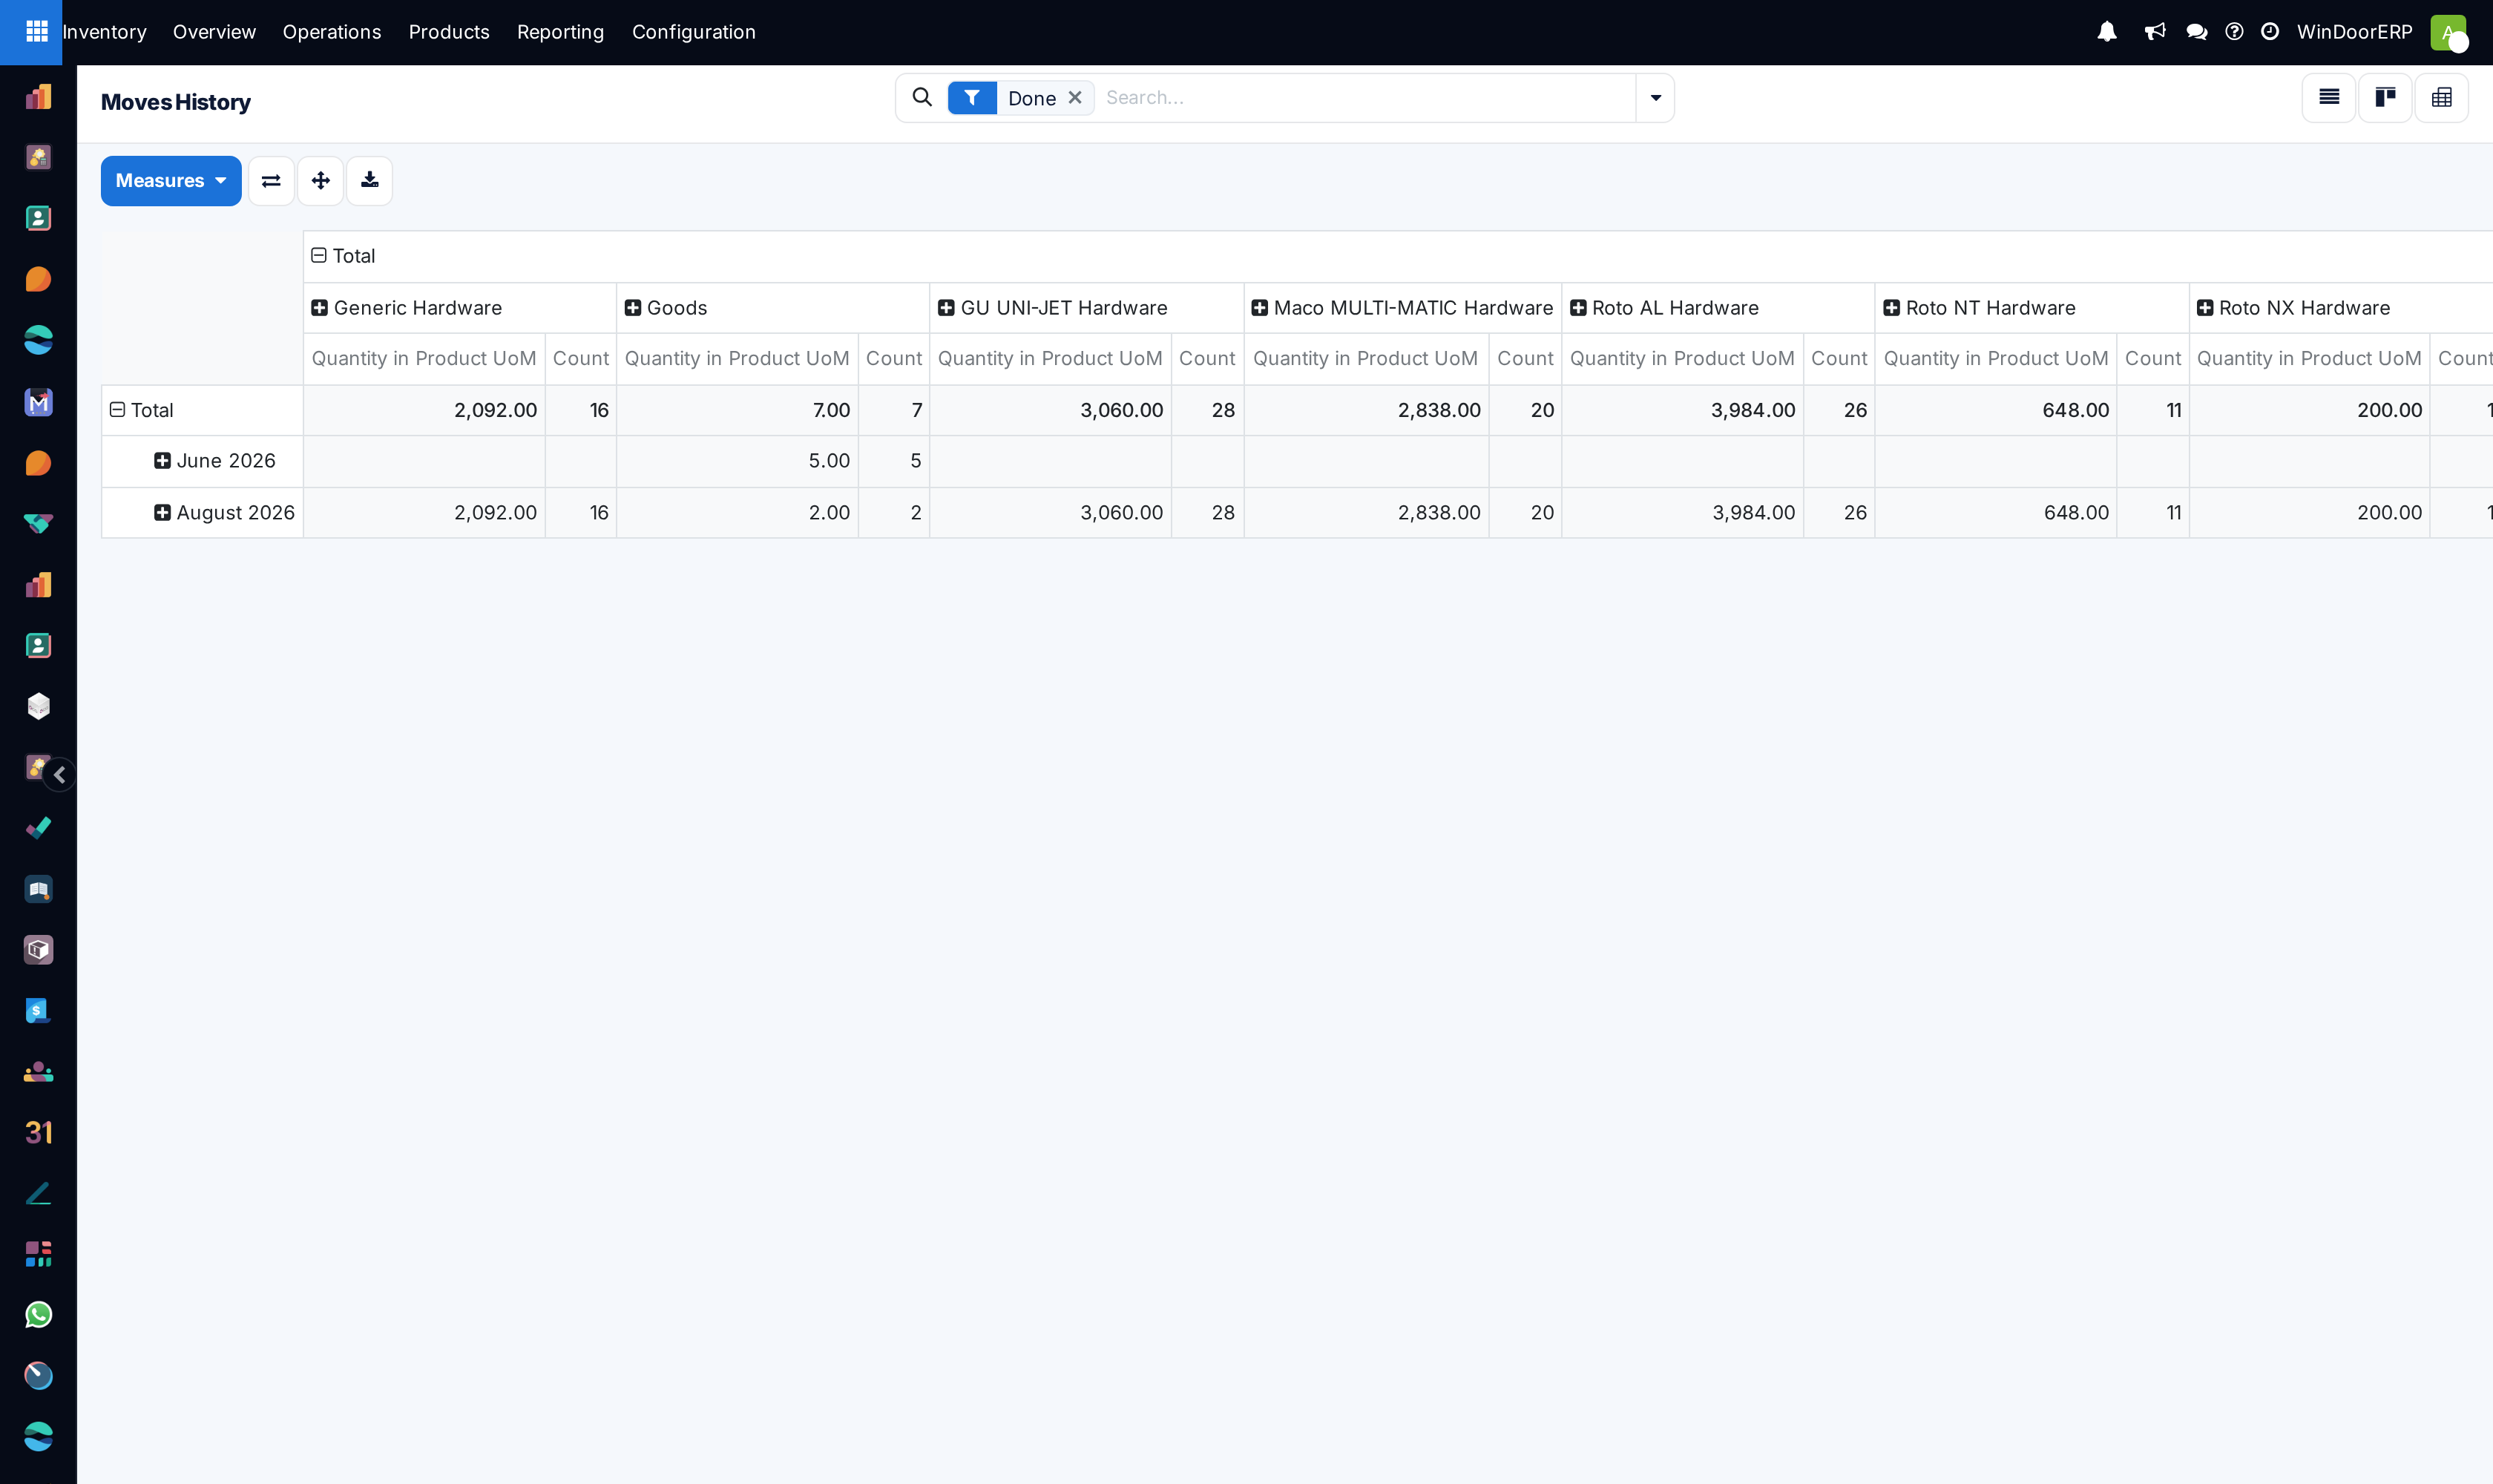
Switch to the Pivot for quantities over time — by month, by product, by location — or the kanban for a card feed.
-
06
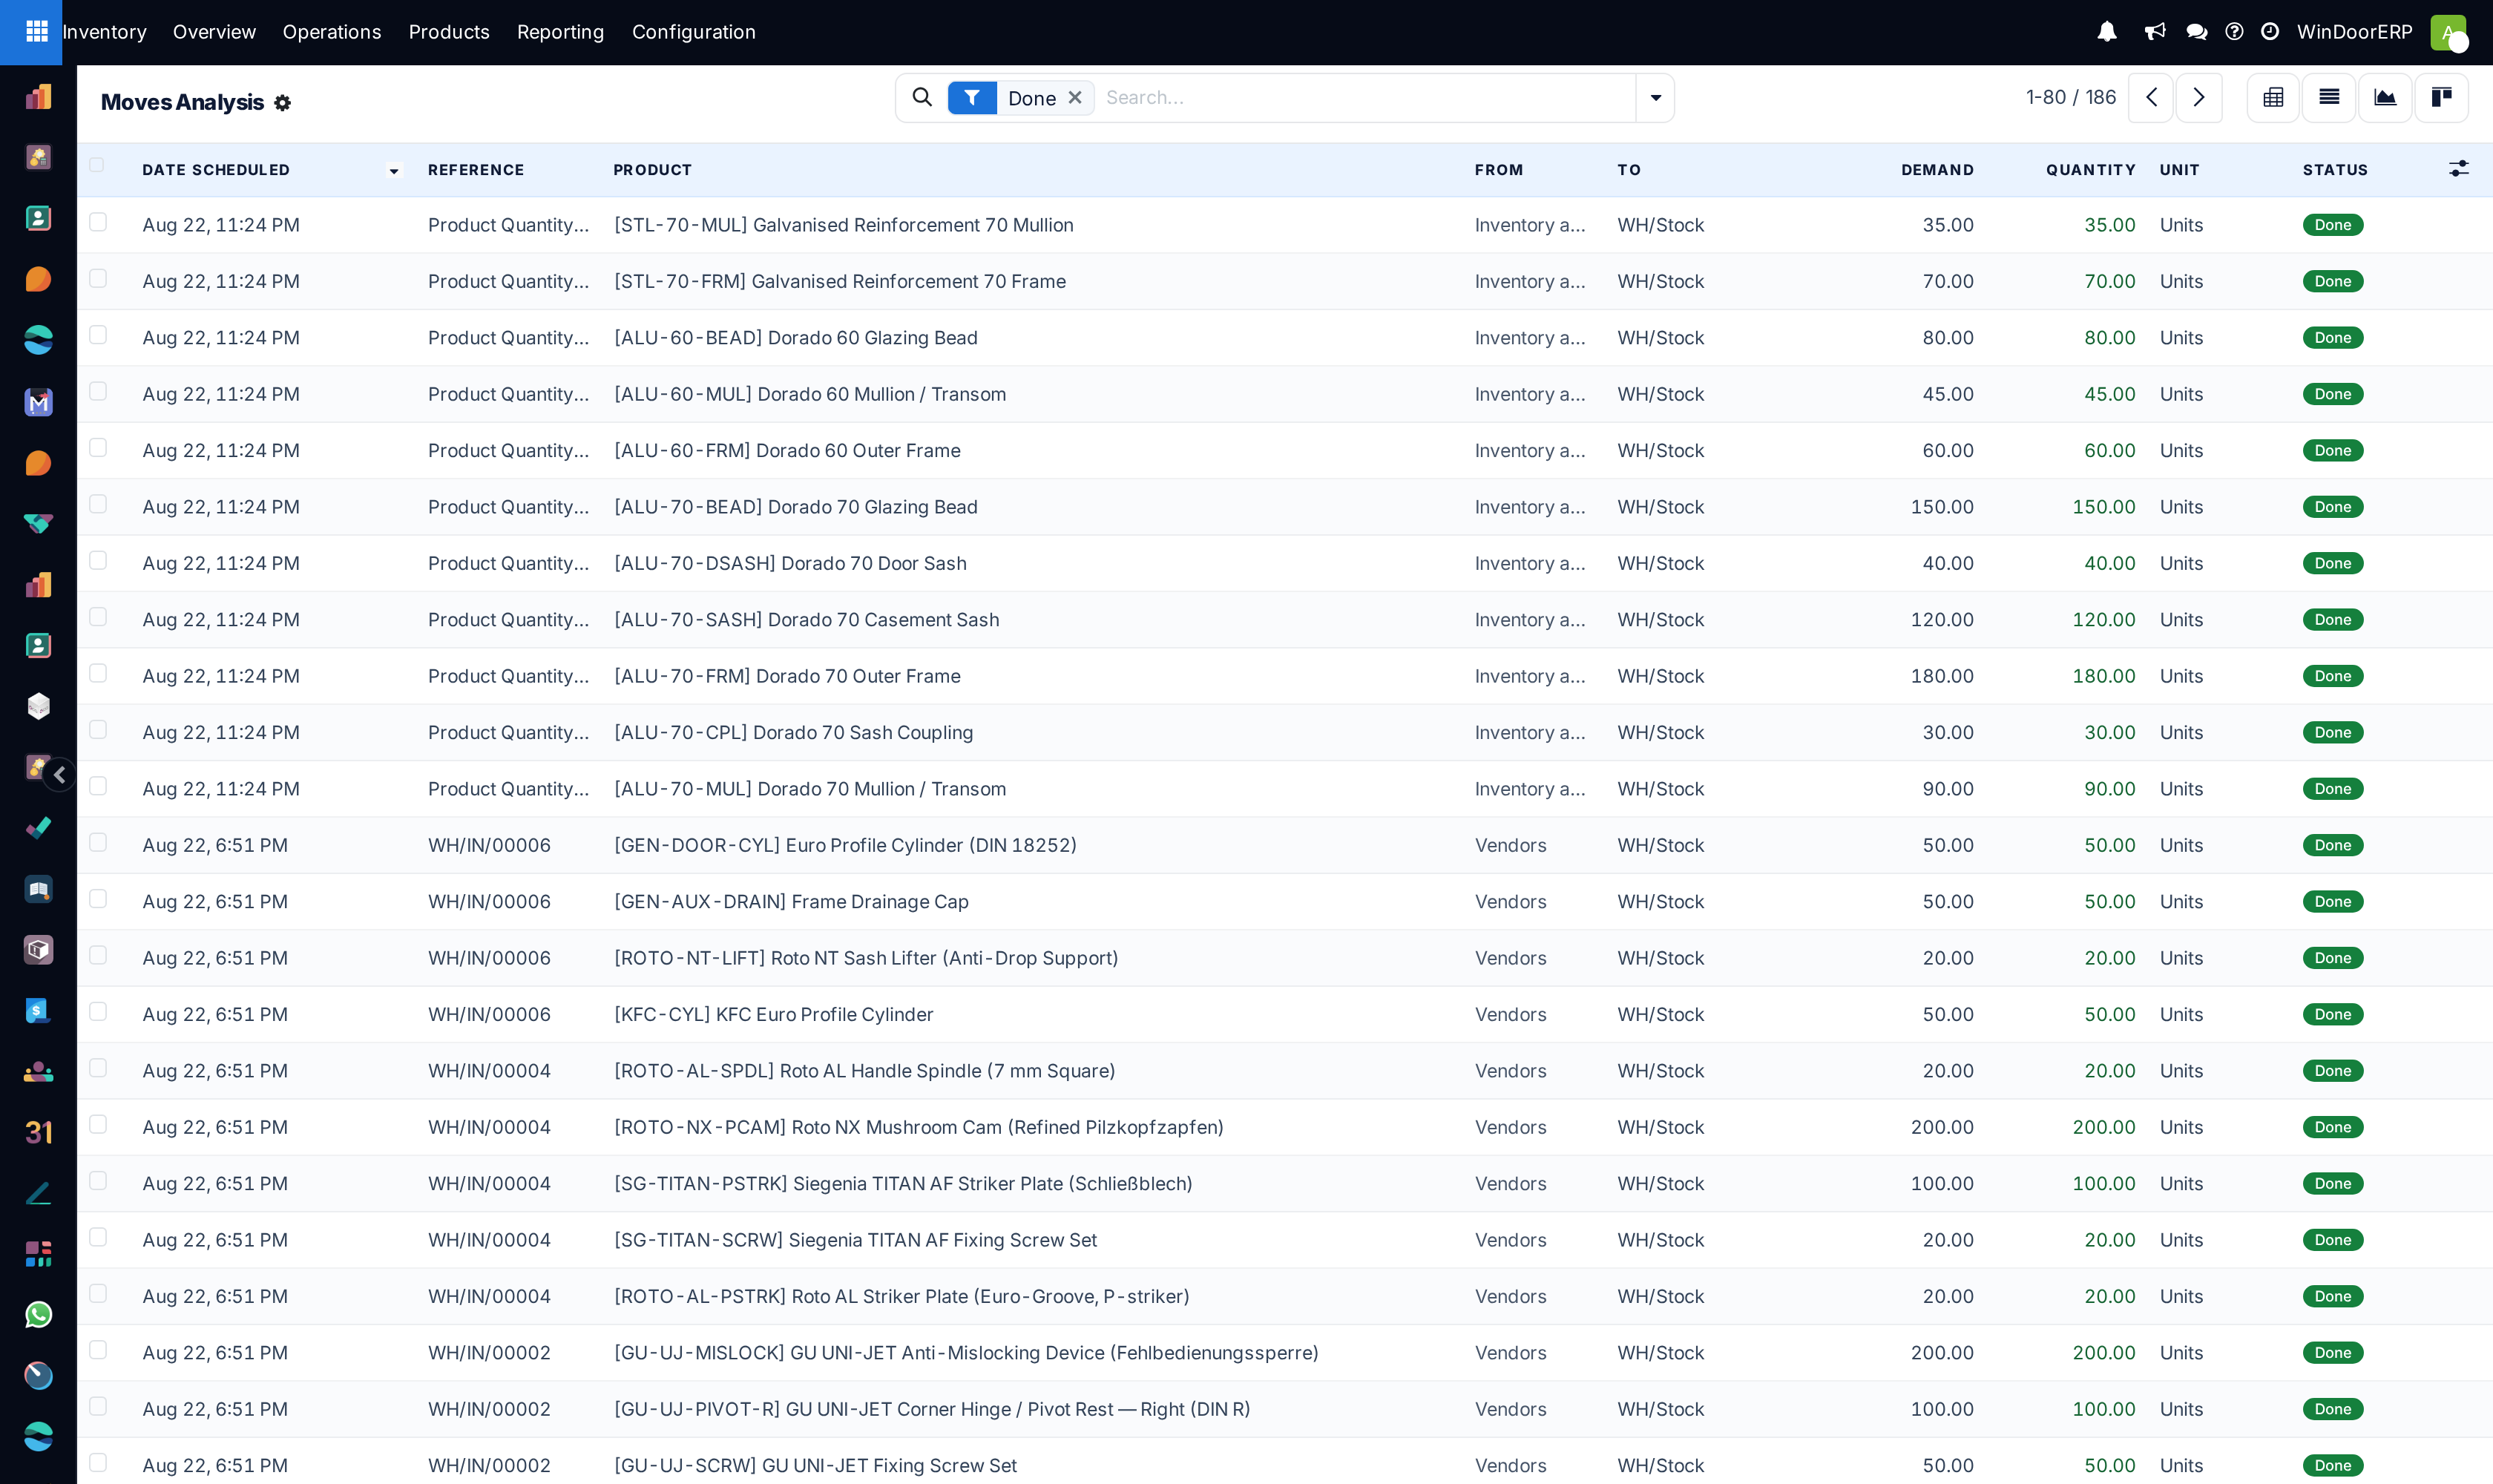
For quantities with value, open Reporting › Moves Analysis: enable the Value (and Remaining Qty / Remaining Value) columns from ⚙, and use its Remaining filter to see receipts not yet consumed by valuation.
Which report answers what
| Question | Report |
|---|---|
| "Show me everything that happened to this profile." | Moves History, product search + Done. |
| "How much moved per month / per location?" | Moves History › Pivot (quantity and count measures). |
| "What was this receipt worth, and how much of it is still in stock?" | Moves Analysis with the Value / Remaining columns. |
| "What was demanded versus what was actually moved?" | Moves Analysis — Demand and Quantity side by side. |
| "What is still planned rather than done?" | To Do on either list; Ready exists only on Moves Analysis. |
Note
Moves History carries no value column — it is a quantity trail; money lives in Moves Analysis. And Moves Analysis offers list and form only: the pivot for time-series analysis is Moves History's. Neither is a mistake; they split the job.
Troubleshooting
| A movement is missing from the trace | It has not been validated — the Done filter hides planned work. Switch to To Do to see it waiting. |
|---|---|
| The dates look wrong for night-shift work | Dates are timestamps in your timezone; check the user's timezone setting before blaming the trail. |
| No pivot on Moves Analysis | By design — use Moves History's pivot for aggregation, Moves Analysis for values. |
| Red lines everywhere in a product's history | Red references are scraps; red quantities are ordinary outgoing moves. Read the reference colour and the quantity colour separately. |
| Value columns are empty-looking on Moves Analysis | They are optional-hidden — enable them from ⚙. Remaining value applies to incoming moves; deliveries show value only. |
Common mistakes
- Auditing from the transfer documents instead of Moves History — a transfer can carry many products; the history line is the per-product truth.
- Summing Moves History quantities without direction — incoming and outgoing lines both count positive; group with the Incoming/Outgoing filters, or use the pivot.
- Tracing serialized finished windows here and wondering where the per-piece story is — piece-level tracing (who scanned what, when, at which station) lives in Production's Piece Scans, not in stock moves.
- Expecting money in Moves History — quantity trail only; switch reports.
Was this article helpful?
Thanks — your feedback helps.
Running a window or door factory?
Ask for a demo