Total your own quotations in the pivot and graph — and where win rate really lives
What this does
My Quotations offers a pivot and a graph on the same documents you see in the list, and they do one job well: they total money. Group the quotations you own by month, by customer, by salesperson or by status, read the figure, and export it.
What they do not do is measure whether you win. There is no win rate on this screen, no margin, and no discount percentage — not hidden behind a setting, not there at all. This article covers what the two views really offer, why their totals are easy to misread on a system that uses quotation revisions, and exactly where the win, loss and discount numbers are kept instead.
Before you start
- The pivot and the graph are on the screen every salesperson already has, so nothing extra is needed to read your own figures.
- CRM › Reporting is open to anyone with the Salesperson role, so the win and loss figures below are within reach of the whole team.
- Sales › Reporting, where the discount and conversion figures live, is restricted to the Sales Manager role. If that menu is not in your Sales app, that is why.
- Both views obey the search bar. Whatever facet is applied when you switch view is still applied afterwards, including the My Quotations one.
Total what you own
-
01
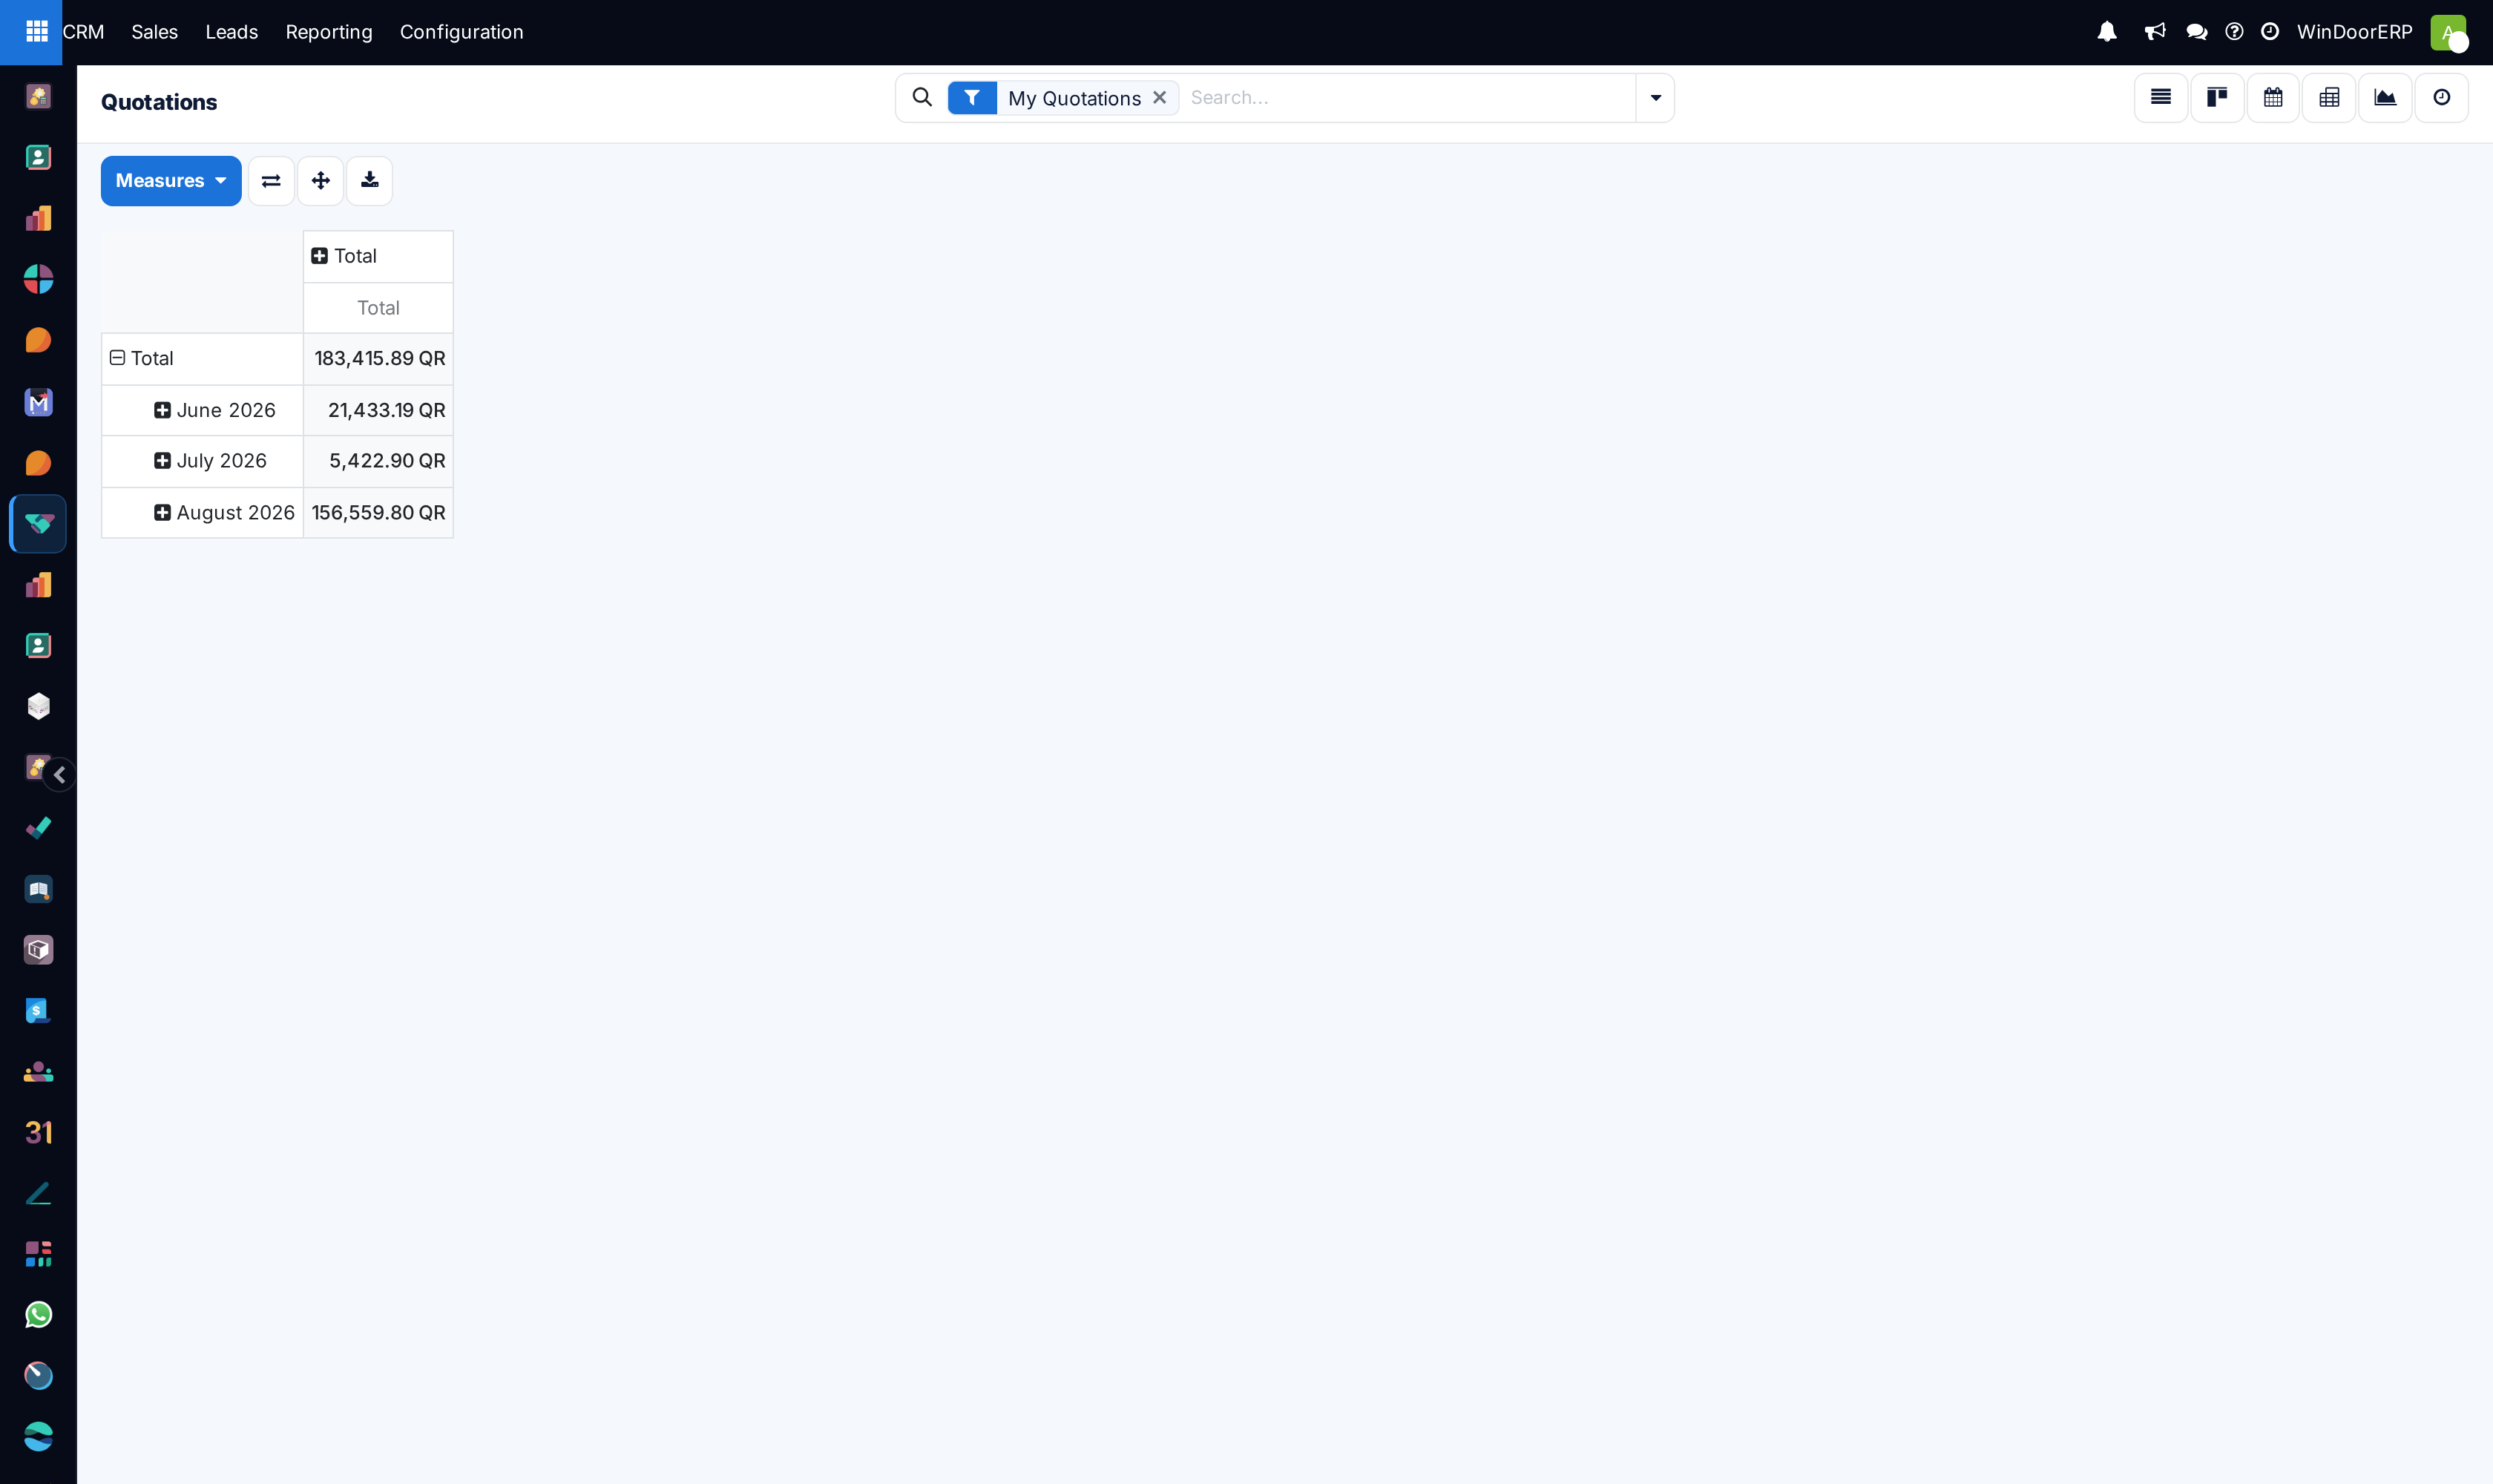
Open CRM › Sales › My Quotations and click the pivot icon in the view switcher.
-
02
The table opens with one row per month of the order date and a single measure, Total. The corner cell is the same number as the foot of the list.
-
03
Use Measures to change what is being added up, and the + on a row or column header to open it by salesperson, customer, status or anything else in the group-by list.
-
04
Use the flip button to swap rows and columns, the expand button to open every level at once, and the download button to take the table into a spreadsheet.
-
05
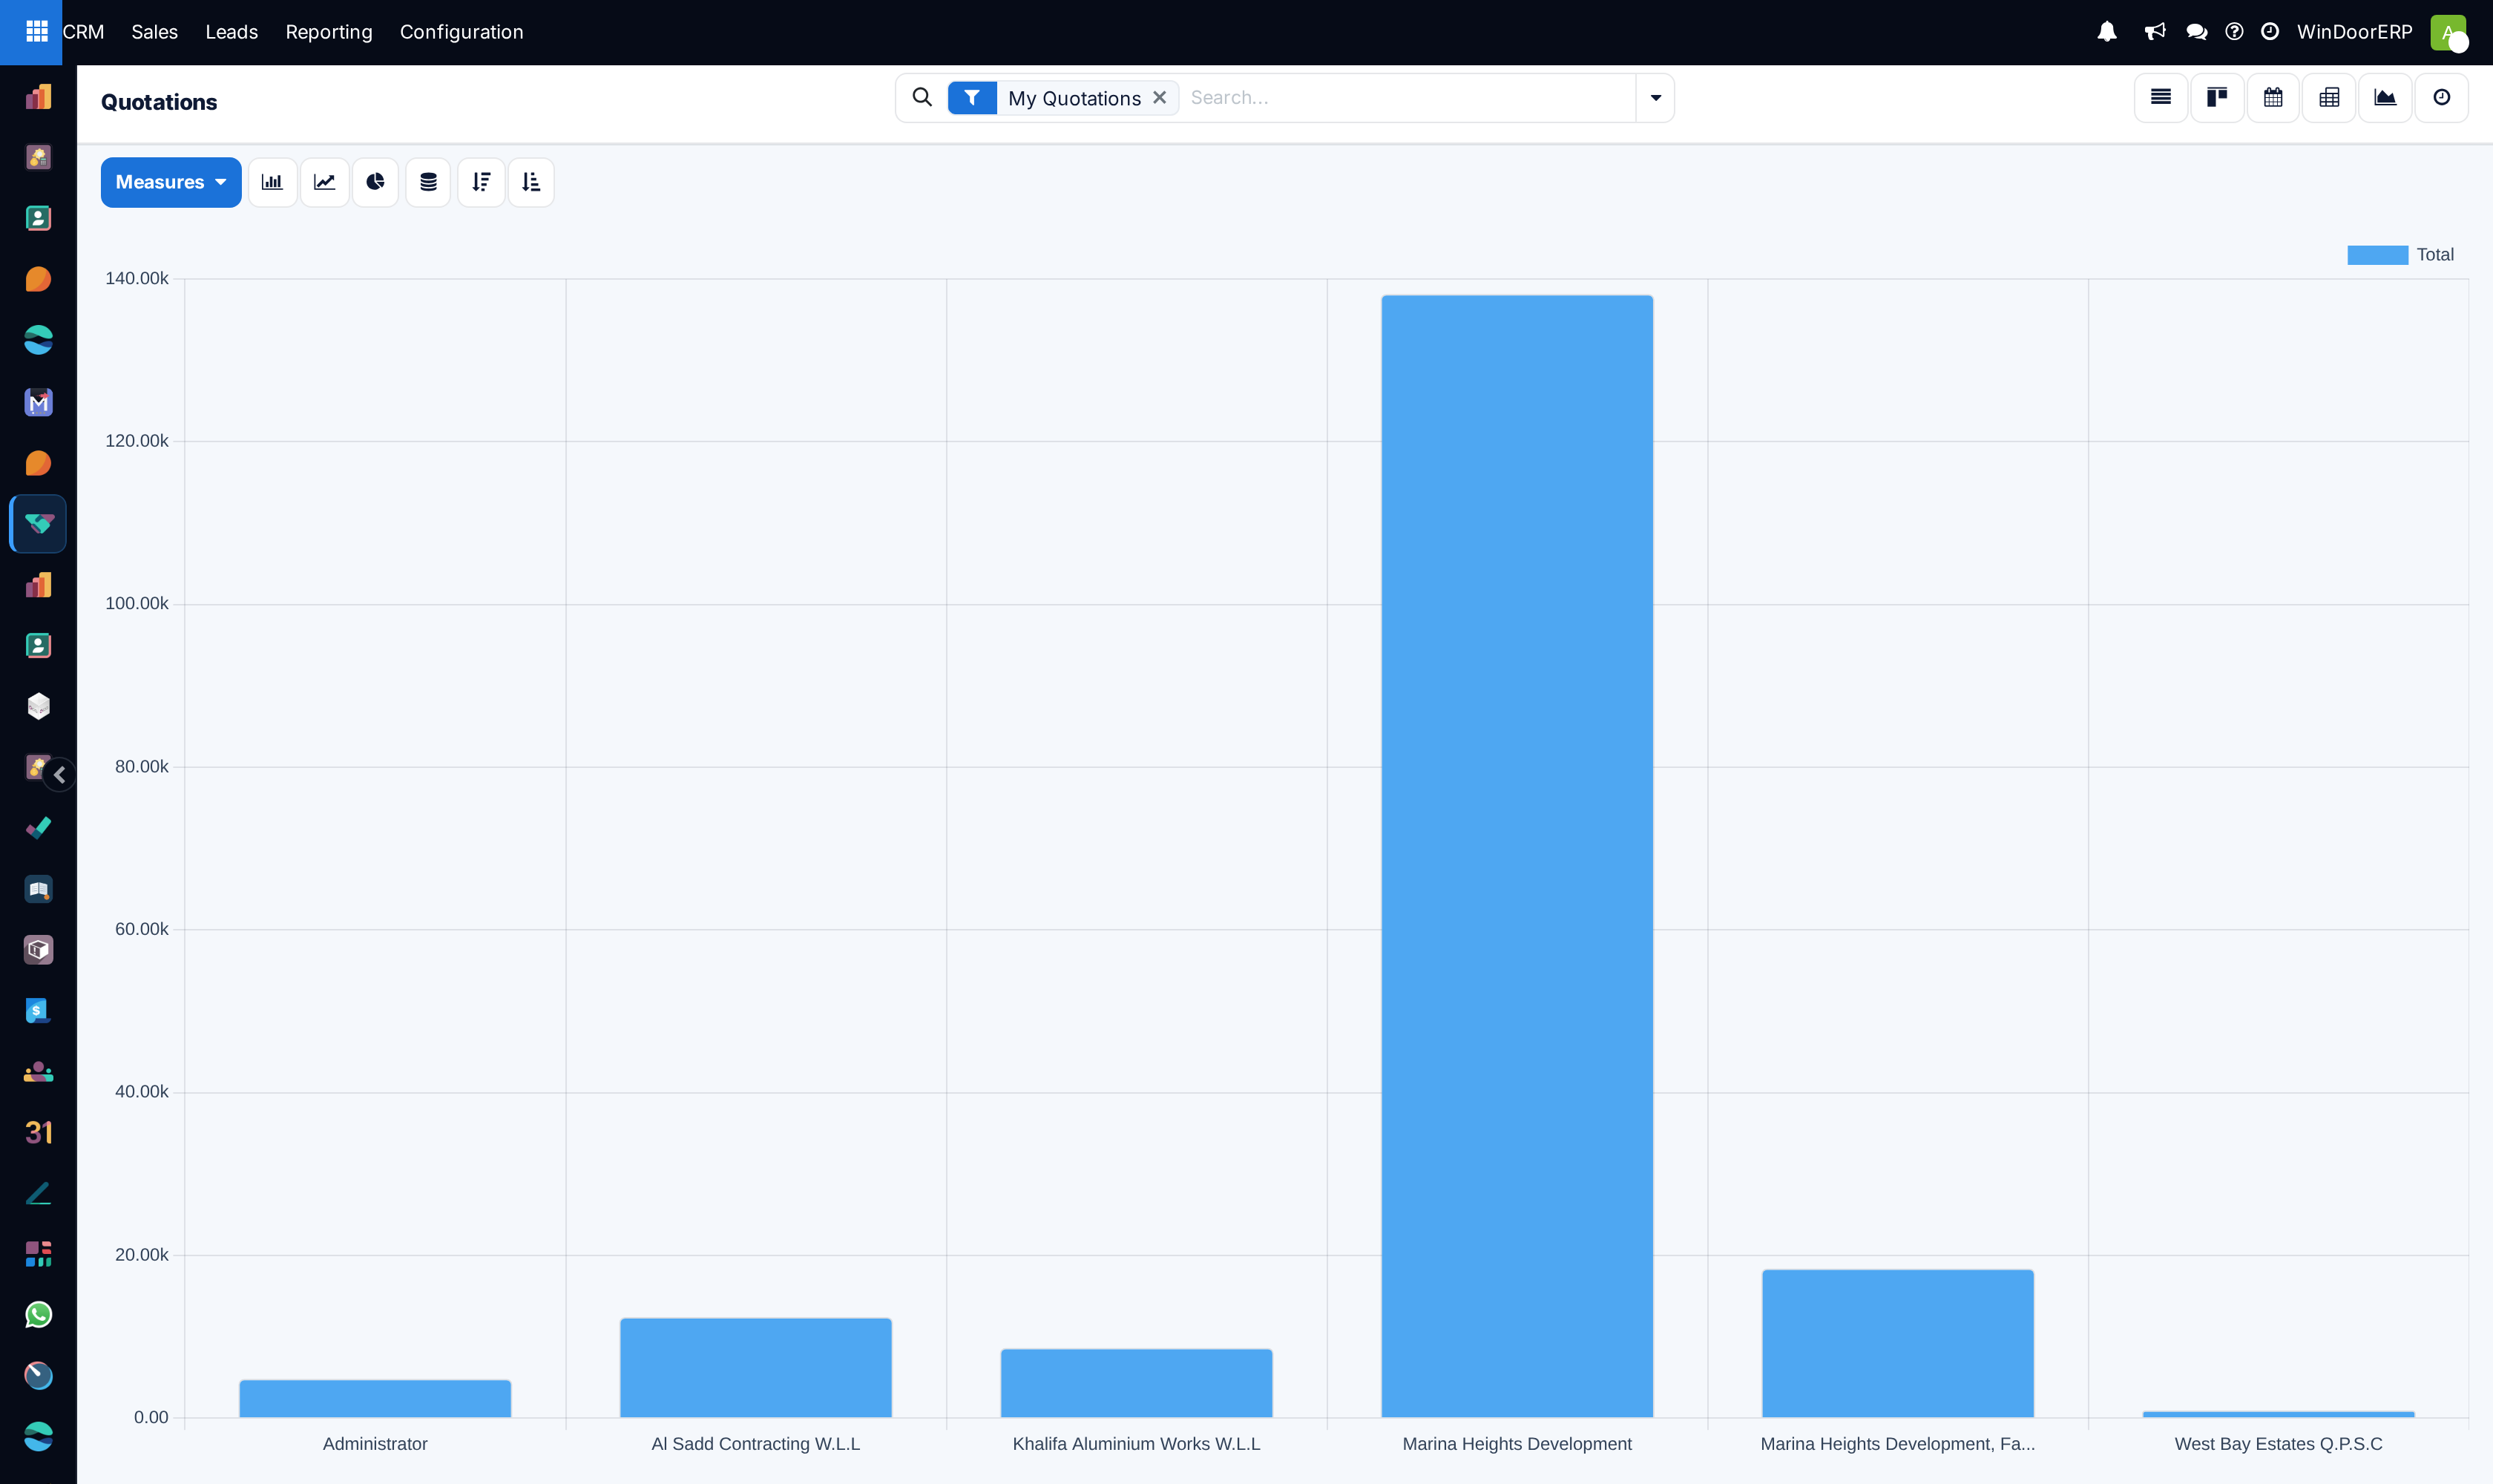
Switch to the graph icon for the same data as a chart — bars, lines or a pie, ascending or descending, stacked or not.
What you can measure, and what is missing
The Measures list is built from the numbers stored on a quotation, which is a short list.
| Measure | What it adds up |
|---|---|
| Total | Tax included. The default, and the same figure the list totals. |
| Untaxed Amount | Before tax. This is the one to use when comparing against a target or a forecast, since expected revenue on a deal is untaxed too. |
| Taxes | The tax portion on its own. Rarely what you want. |
| Count | How many documents are in the cell. Not how many deals — see below. |
A few technical values also appear in the list — Revision Number, Prepayment percentage, Currency Rate and the delivery coordinates among them. They are stored numbers, so the pivot offers to add them up; adding up a revision number or a latitude produces a figure with no meaning. Ignore them.
There is no Margin and no Discount measure here
Margin needs the cost of what was quoted to be carried on the line, and the module that does that is not installed on this system, so no screen anywhere shows a margin on a quotation or an order. Discount is a percentage on each line rather than a number on the document, so it cannot be totalled here either — but it is reported, in Sales Analysis, which reads the lines. Both are covered in the table further down.
The two toolbars
| Control | Where and what it does |
|---|---|
| Measures | Both views. Ticks and unticks what is being added up; several at once is allowed in the pivot. |
| Flip axis | Pivot. Swaps the row grouping with the column grouping without re-choosing either. |
| Expand all | Pivot. Opens every group at every level. Use it after you have chosen the groupings, not before. |
| Download xlsx | Pivot. Exports exactly what is on screen, opened groups included. |
| Bar, line, pie | Graph. The graph opens as bars grouped by customer. |
| Stacked | Graph, bars only. Stacks a second grouping inside each bar instead of putting them side by side. |
| Ascending, descending | Graph. Sorts the bars by value, which is the fastest way to find the biggest account. |
Why these totals are not a win rate
Three things stand between this screen and the question people bring to it.
| Obstacle | Why it matters |
|---|---|
| It counts documents, not deals | Every row is a quotation or an order. One opportunity can carry several of them, and a quotation can exist without any opportunity behind it at all. |
| Revisions are counted again | A revision is a separate document that keeps its predecessor alive beside it. A job quoted, revised and revised again is three rows, and its value lands in the total three times. On a system that uses revisions properly, quoted value read off this screen is systematically overstated. |
| A quotation has no won or lost | Its four statuses are Quotation, Quotation Sent, Sales Order and Cancelled. A quotation that lost is not marked as anything — it usually just sits at Quotation Sent forever. Winning and losing are properties of the opportunity in the pipeline, not of the paperwork. |
Grouping by Status and comparing the count of Sales Order against the rest is the nearest thing this screen can give you, and it is worth doing as a rough check. Just do not publish it as a win rate: the denominator contains every revision and every quotation that was never really a live chance.
Where the real numbers live
| The question | Where it is answered |
|---|---|
| What proportion of our deals do we win? | CRM › Reporting › Pipeline. Opportunities carry a won-or-lost state, so the Won and Lost filters, grouped by salesperson, team or lost reason, give a real ratio — and a reason for the losses. Covered in Analyse win/loss and pipeline performance. |
| Why do we lose? | Same screen, grouped by Lost Reason. The reason is chosen when a deal is marked lost; see Close a deal as lost. |
| How much of what we quote turns into orders? | Sales › Reporting › Sales — the Sales Analysis report. Its Quotations and Sales Orders filters and its Status grouping split the same population properly, over a chosen period. |
| How much discount are we giving away? | Sales Analysis again, which reads order lines and therefore offers Discount % and Discount Amount as measures. This is the only place discount is reported. |
| How is each salesperson doing? | Sales › Reporting › Salespersons opens Sales Analysis already grouped by salesperson. For pipeline behaviour rather than turnover, group CRM Reporting by Salesperson instead. |
| What margin are we making? | Nowhere. The optional module that puts a cost and a margin on a sales line is not installed on this system. Comparing a quoted price against what a job actually cost has to be done against production and purchase figures, or asked for as a change. |
Sales Analysis counts lines, not documents
The report is built one order line at a time, so its Count is a count of lines and # of Lines means the same thing. An order with twenty window types weighs twenty times as much as an order with one. Group by Customer or Salesperson and read the money, not the count.
Troubleshooting
| What you see | Why, and what to do |
|---|---|
| No Margin in the Measures list | It does not exist on this system. Nothing is misconfigured and no filter is hiding it. |
| No Discount in the Measures list | Discount lives on the line, not the document. Use Sales Analysis. |
| The pivot total is bigger than you expect | Confirmed orders and every revision are in it. Add the Quotations filter, or group by Status to see the split. |
| The graph shows one enormous bar | It groups by customer by default and one project can dwarf the rest. Sort descending, or switch the grouping to month. |
| There is no Reporting menu in the Sales app | It is restricted to the Sales Manager role. CRM's own Reporting menu is not, so start there. |
| Two reports disagree about the same period | They almost certainly are not measuring the same thing: this screen totals documents you own, Sales Analysis totals lines across the company, and CRM Reporting counts opportunities. Check which population each one has before reconciling them. |
| The exported spreadsheet is missing detail | The download takes what is displayed. Expand the groups you want first, then export. |
Common mistakes
- Quoting the pivot total as pipeline value, when it counts revisions, confirmed orders and abandoned quotations alike.
- Calling the ratio of Sales Order rows to the rest a win rate, and reporting it upward.
- Looking for margin on the quotation screen and concluding somebody has removed it.
- Reading Sales Analysis counts as numbers of orders when they are numbers of lines.
- Adding up Revision Number or a coordinate because the Measures list offered it.
- Comparing a personal screen against a company report and treating the difference as an error.
Was this article helpful?
Thanks — your feedback helps.
Running a window or door factory?
Ask for a demo