Leads reporting: where enquiries come from, losses included
What this does
CRM › Reporting › Leads opens a screen titled Leads Analysis. It counts enquiries: how many arrived, in which month, from which source and campaign, who they went to, and what became of them. It is the report for judging where business comes from, rather than what it is currently worth.
It shares its entire search panel with Reporting › Pipeline — the same filters, the same groupings, the same measures. Everything that makes the two reports different is the set of filters each one arrives with, and that difference is visible in the search bar the moment the screen opens.
Before you start
- This menu is always present. Unlike the Leads entry on the CRM's main menu bar, which appears only when the Leads stage is enabled, the reporting entry carries no group restriction at all — every CRM user has it.
- The report deliberately includes archived records. Marking a deal lost archives it, so lost deals are counted here. That is right for a source analysis and wrong for a pipeline view.
- It opens on the current year, filtered by creation date — not by closing date, and not by expected closing date.
- Sources, mediums and campaigns are only as good as the data behind them. If enquiries are typed in by hand without those fields, this report cannot tell you anything about channels.
Steps
Archived records are included on purpose
The first facet reads Active or Inactive — one facet holding two filters, joined by or. Marking a deal lost archives it, so without this the report would only ever count deals that are still alive, and every source would look as though it converted perfectly.
The consequence is that a raw count here is all enquiries received, won and lost together. That is exactly what you want for "which channel brings us work", and exactly what you do not want if you are trying to see the live pipeline. For that, use Reporting › Pipeline.
-
01
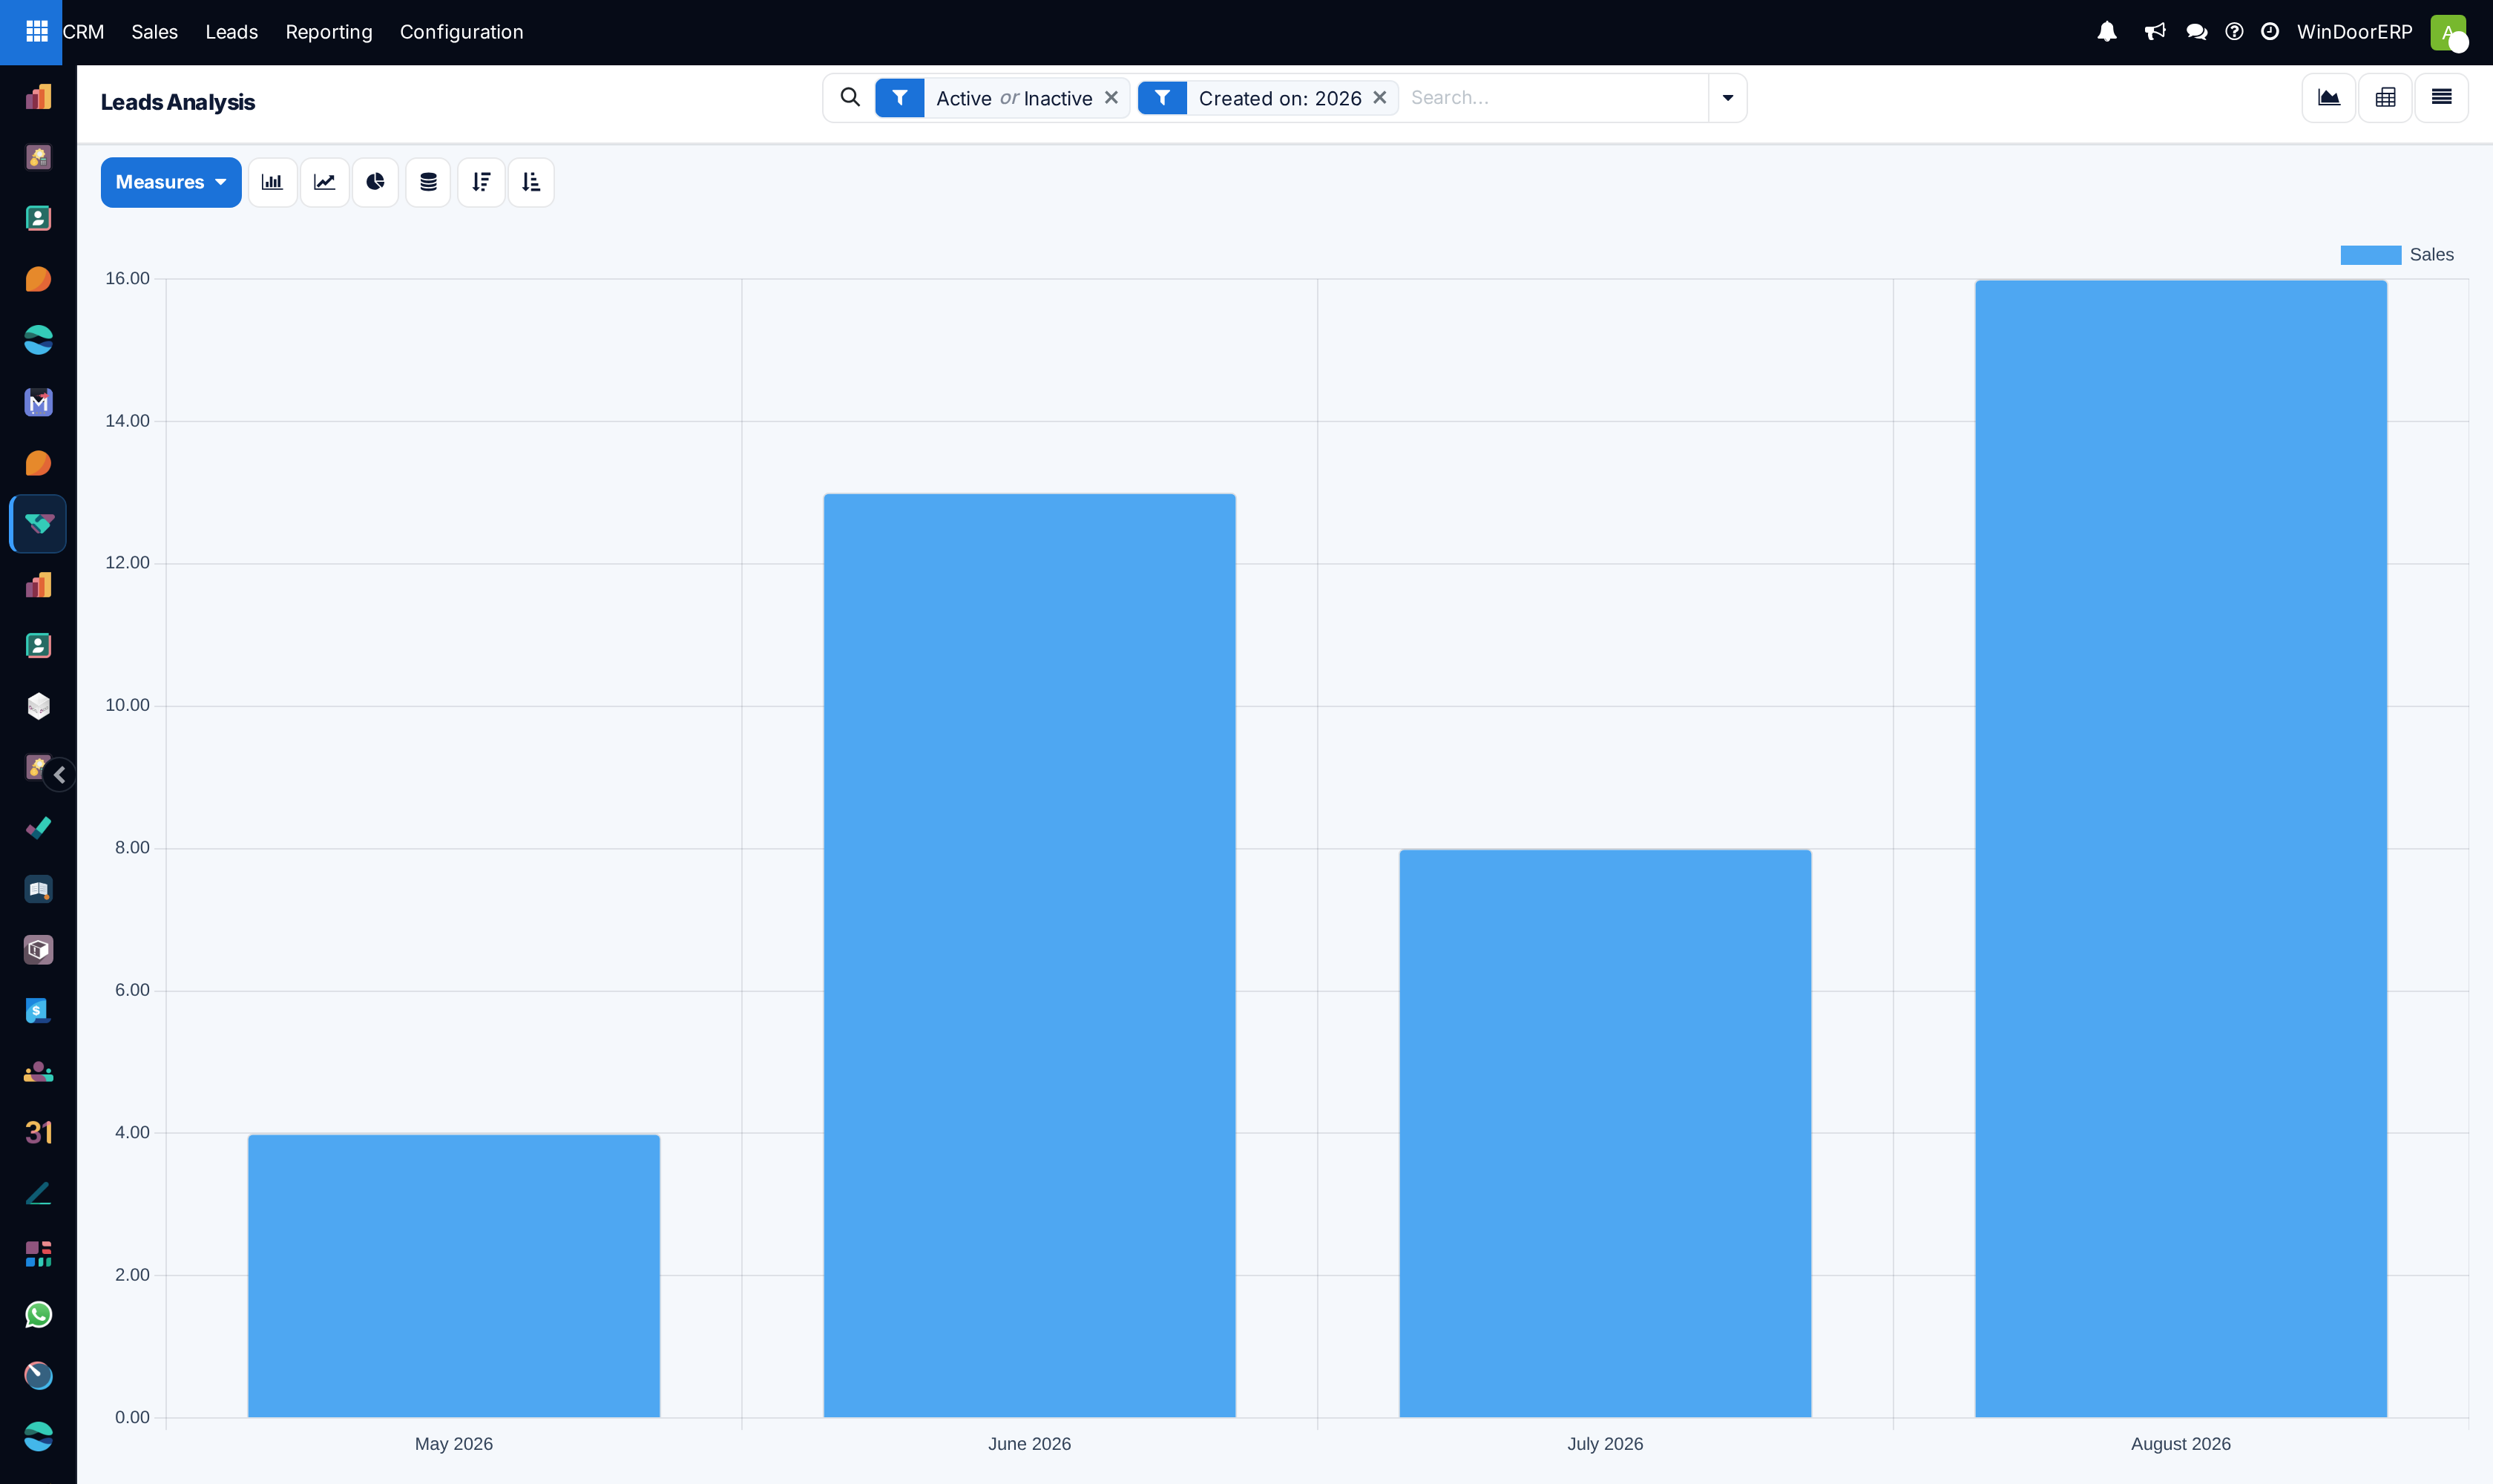
Open CRM › Reporting › Leads. It arrives as a bar graph — one bar per month of creation, coloured by sales team, measuring Count.
-
02
Read the two facets it arrives with: Active or Inactive and Created on: 2026.
-
03
Group by Source, Medium or Campaign to see where the enquiries come from.
-
04
Add a grouping by Won/Lost — from the Custom Group selector at the foot of the Group By menu — to turn a volume count into a conversion picture. Read the section below before reaching for the Won filter instead.
-
05
Open Measures and switch from Count to Expected Revenue or Prorated Revenue when you want value rather than volume.
-
06
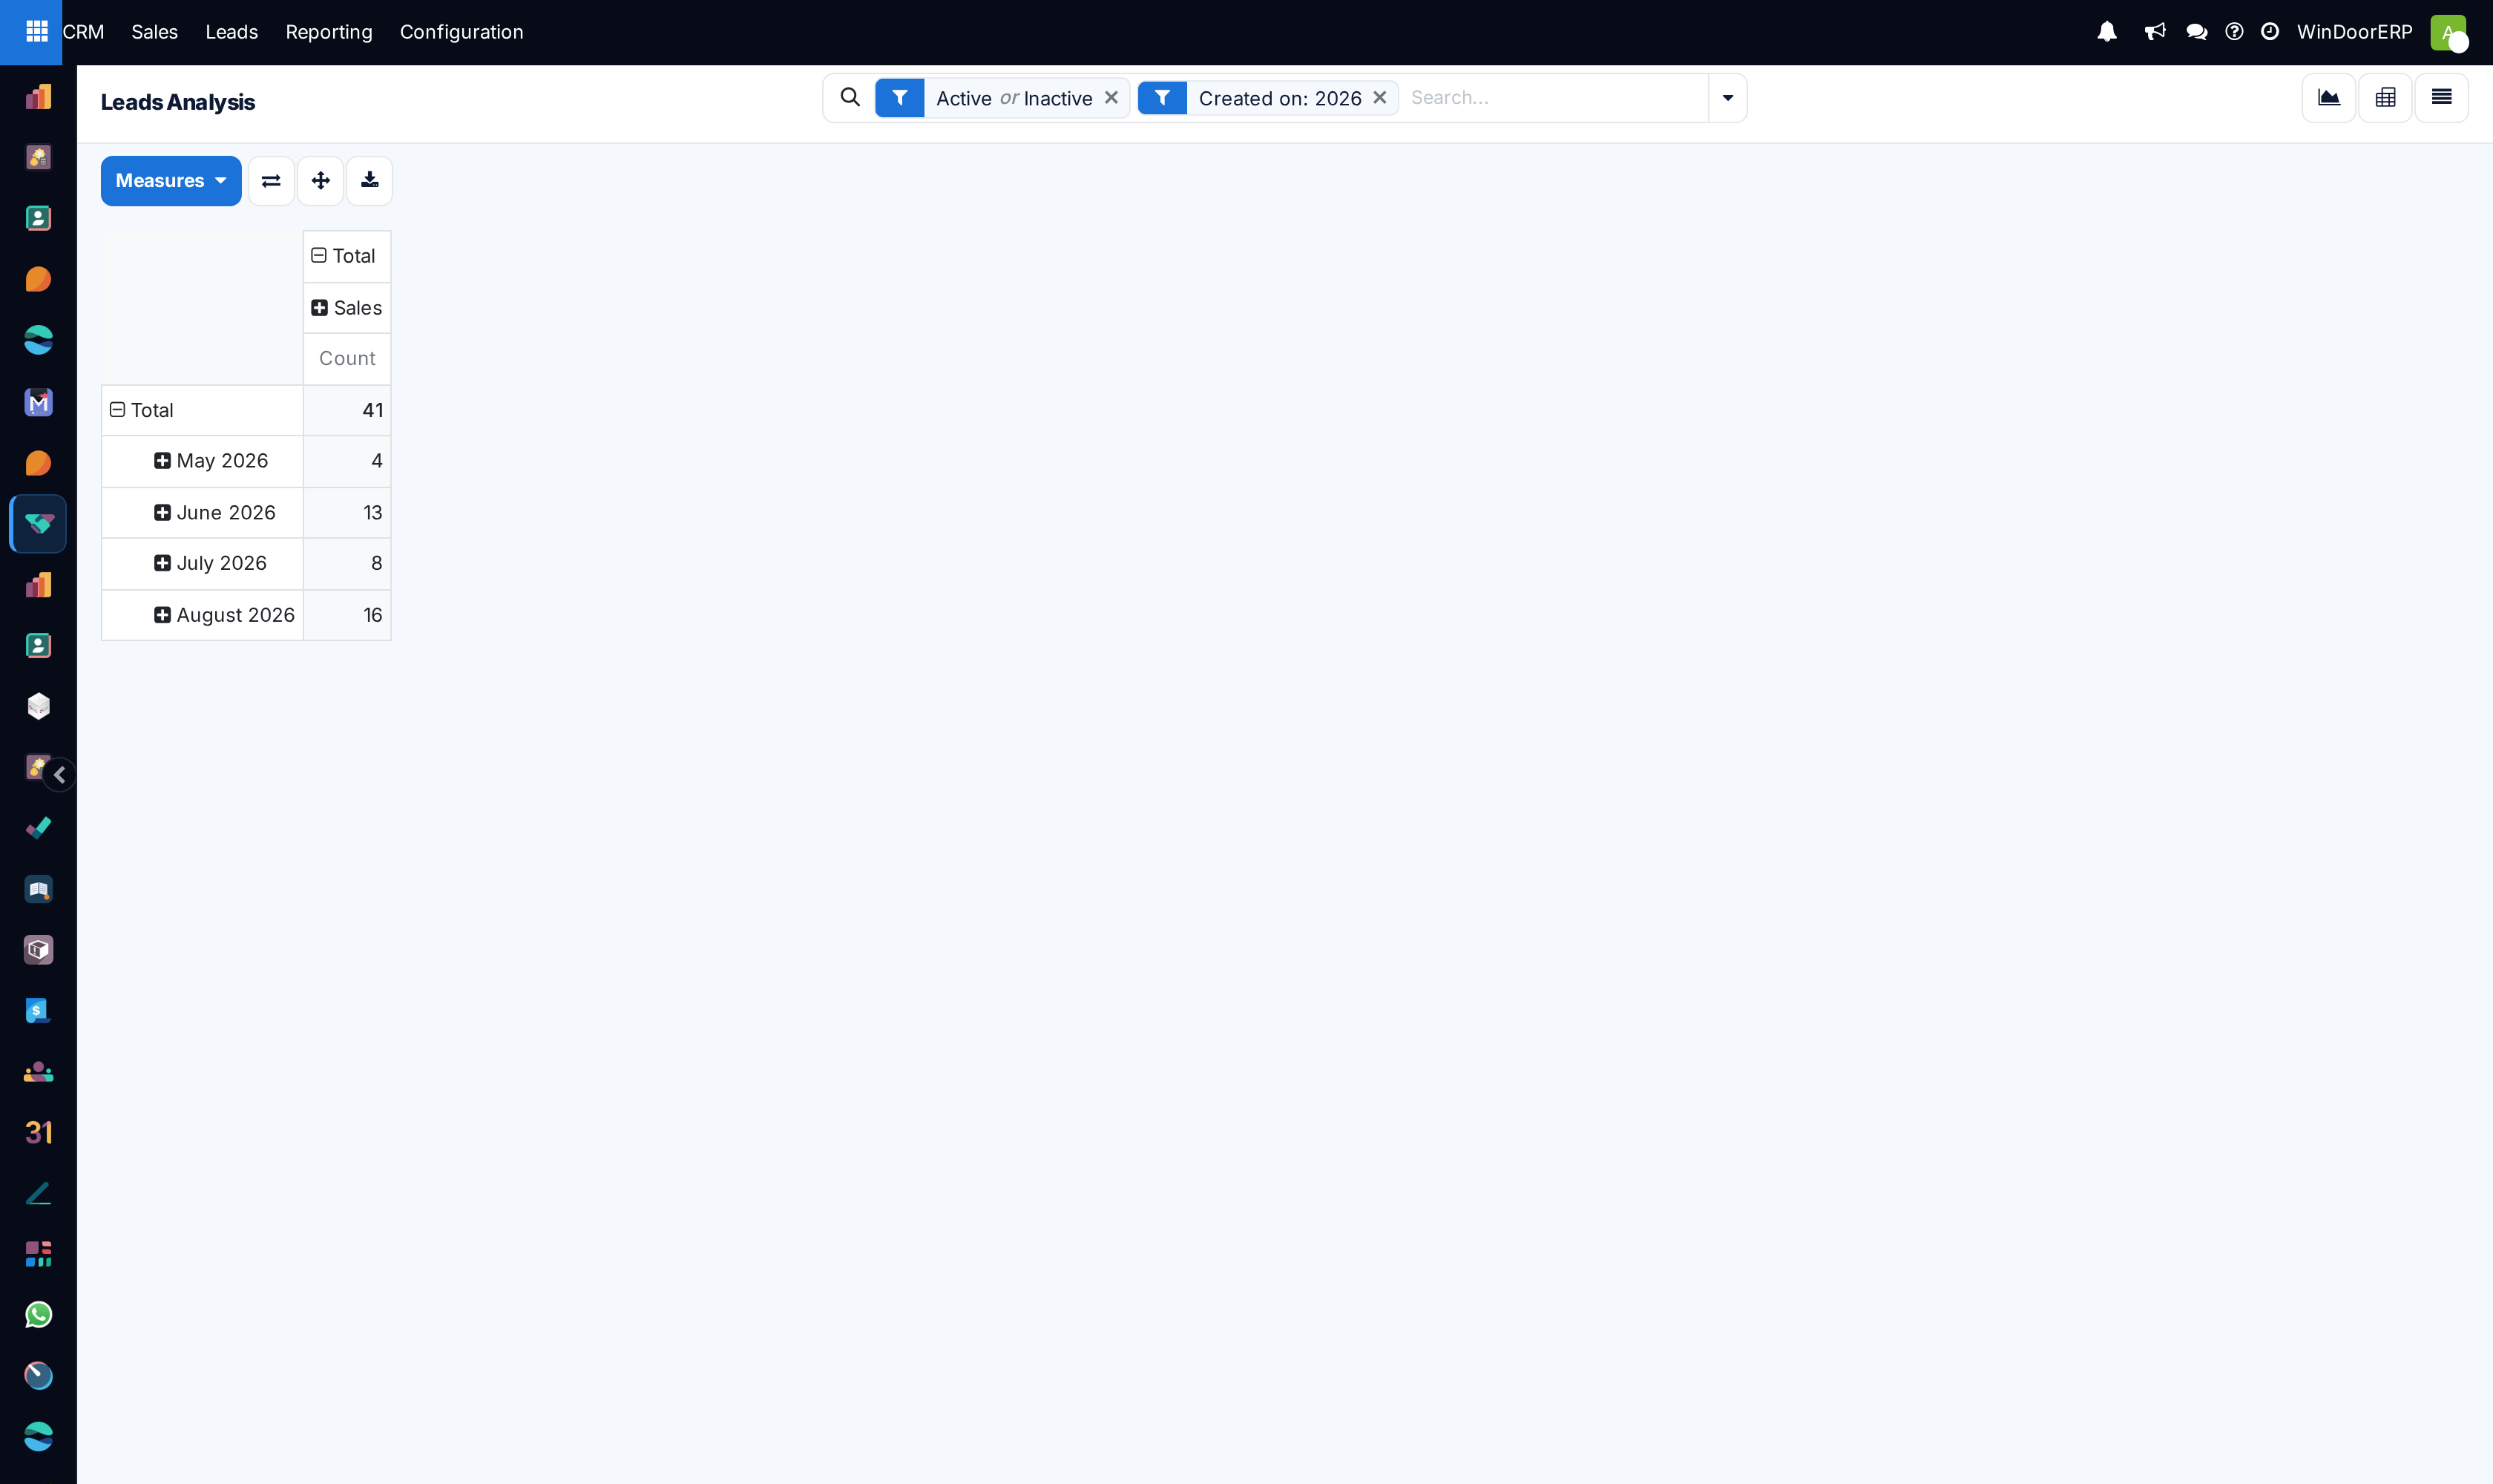
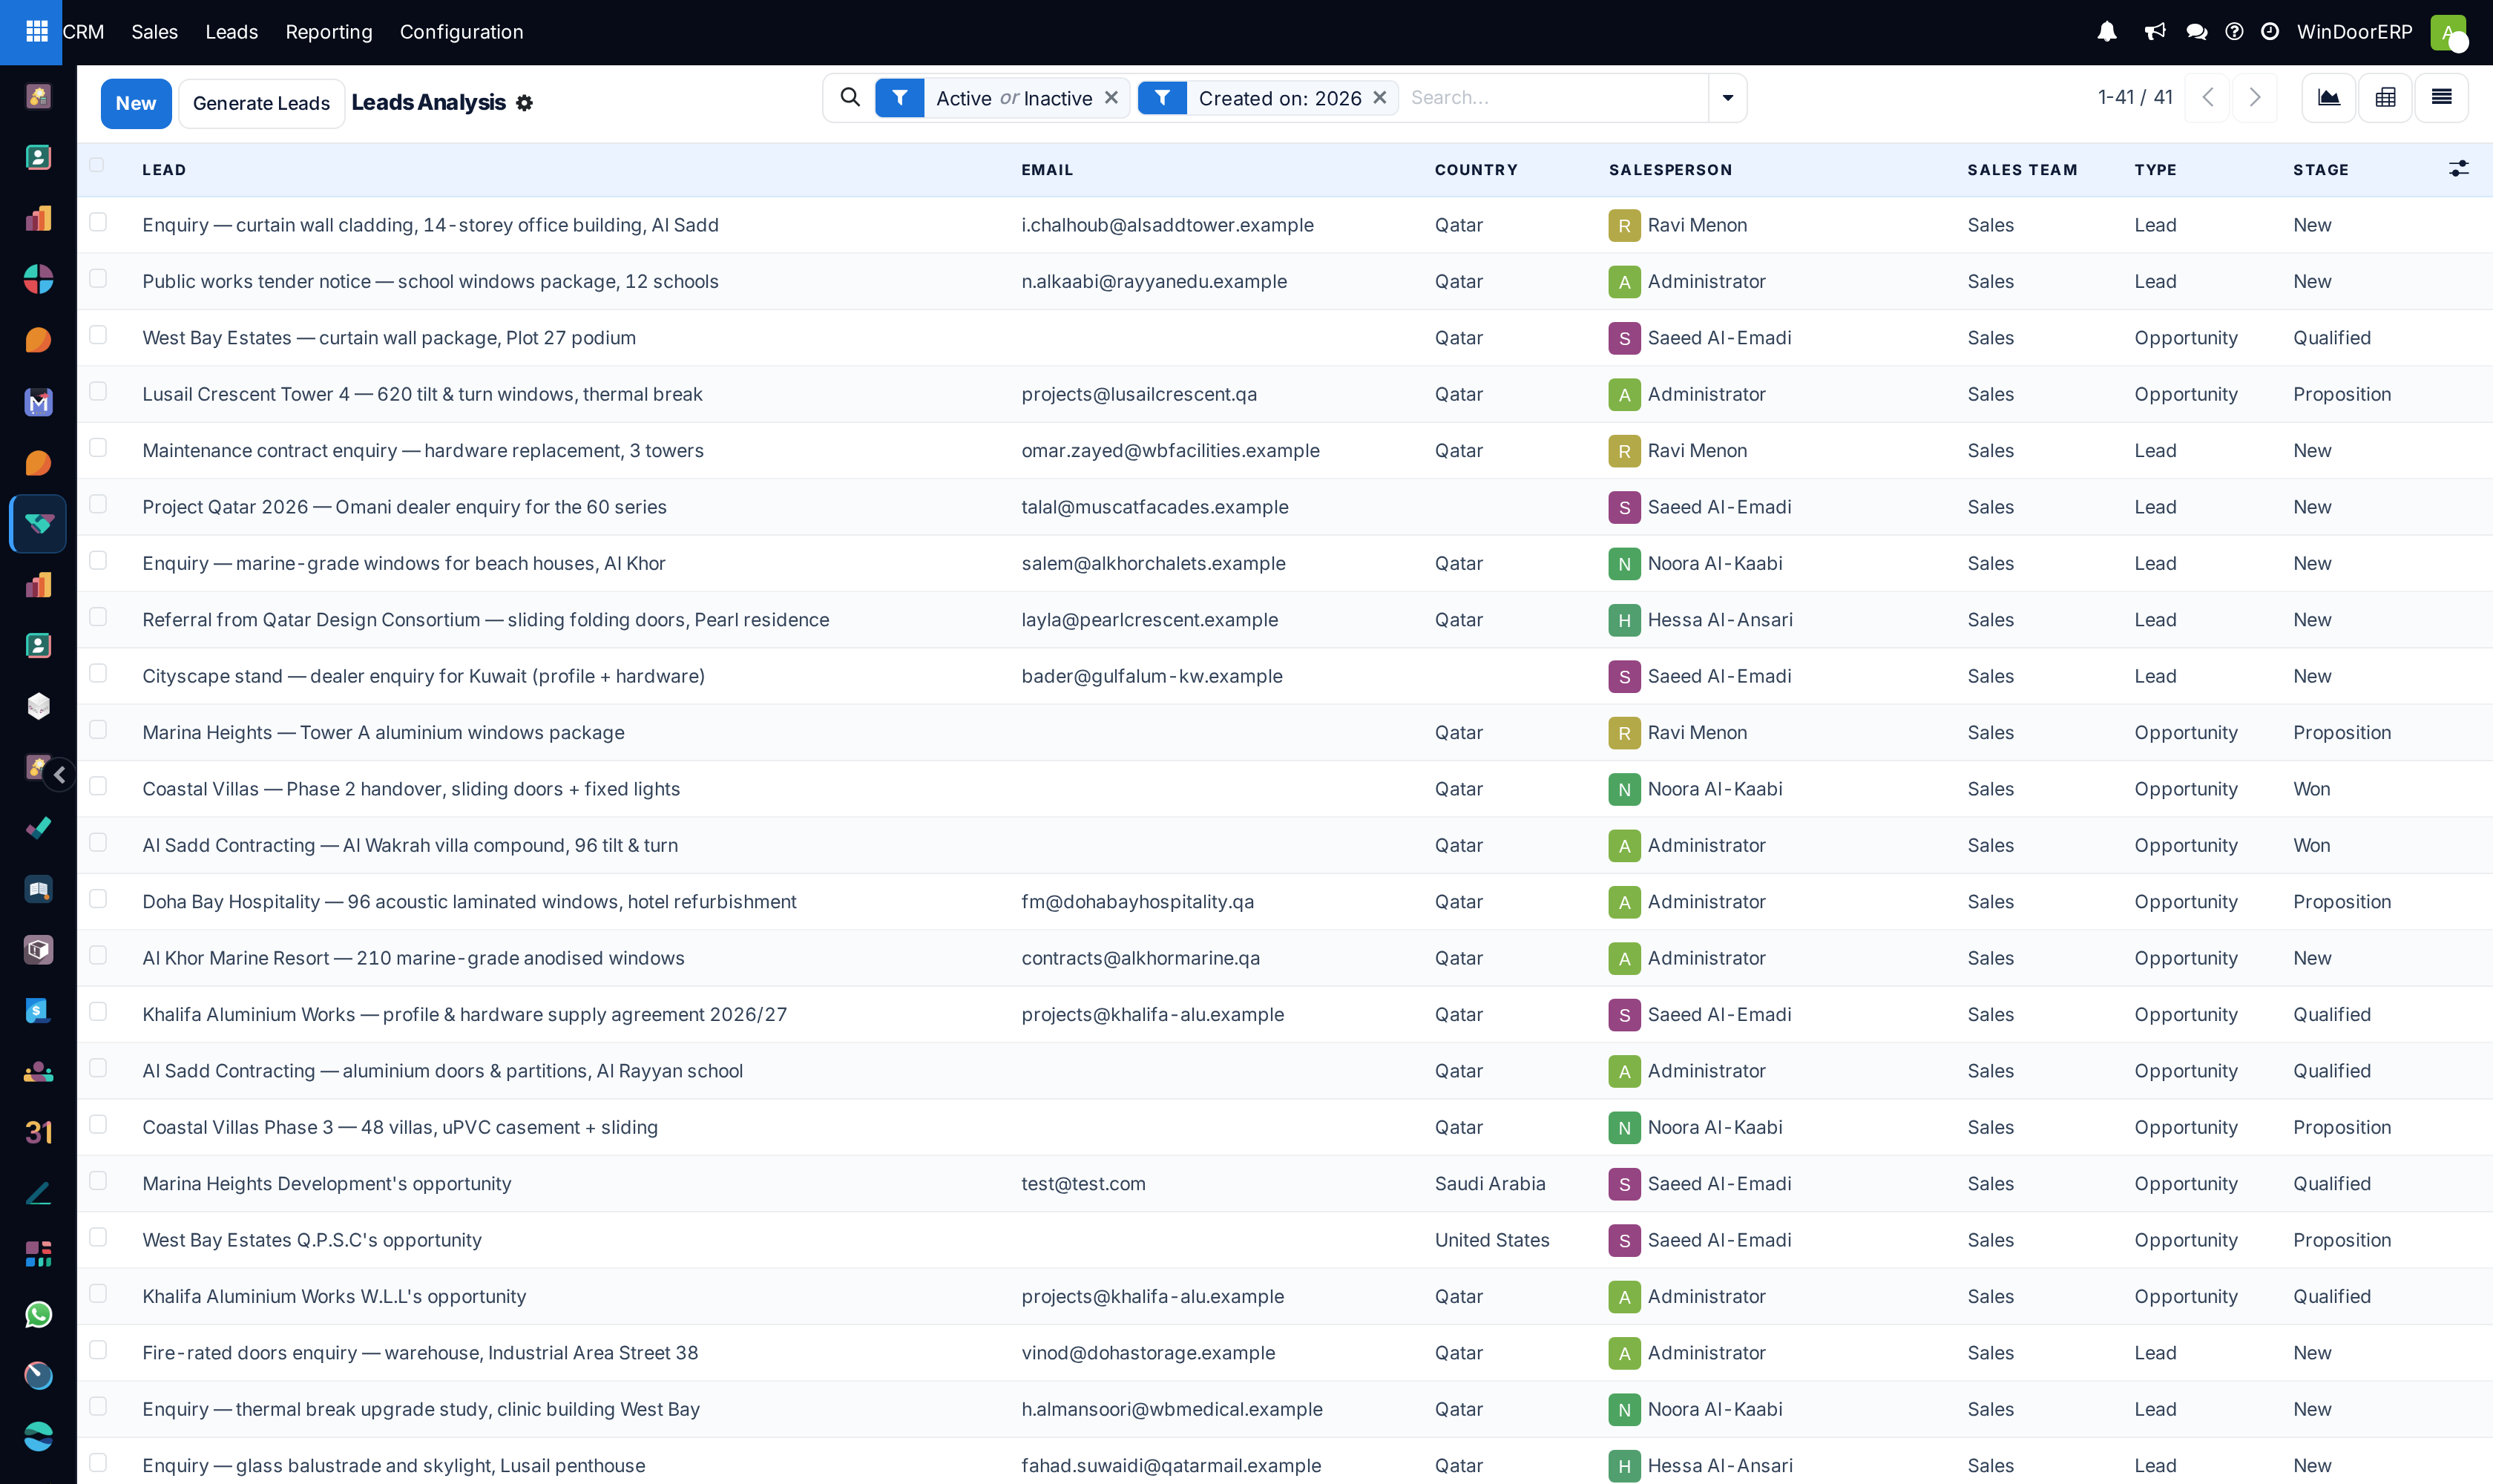
Switch to the pivot for a table you can read across, or to the list for the individual enquiries behind a cell. There is no kanban and no calendar on this action.
Splitting won from lost — not with the Won filter
The search panel offers Won and Lost filters, and they are the obvious thing to click. On this report they do not do what they look like they do.
Active, Inactive, Won and Lost sit in a single group in the search panel, and filters within one group are combined with or, not and. The report already arrives with Active or Inactive applied, which matches every record in the system. Clicking Won simply extends that same facet to Active or Inactive or Won — which still matches everything. The report does not change, and nothing tells you why.
Two things do work. Either remove the Active or Inactive facet first and then apply Won or Lost on its own; or leave the default facet alone and group by Won/Lost instead, which splits the same population into Won, Lost and Pending without filtering anything away. The second is usually what you want, because it keeps the denominator on screen next to the numerator.
What "Lost" actually matches
The Lost filter is not simply "not won". It requires the record to be archived and its Won/Lost value to be Lost. A deal that was archived by hand without being marked lost is not counted by it, and neither is one still sitting at zero probability in an open stage.
What the Leads stage setting changes here
WindoorERP can run its CRM with a single record type — an opportunity created directly — or with a separate qualification step in front of it, where an enquiry starts life as a lead and is converted into an opportunity later. That is a system-wide setting, and on most WindoorERP installations it is switched off: everything is created as an opportunity from the start.
Where the setting is off, three things on this report are simply not there, and no message says so: the Opportunities and Leads filters, the Conversion Date grouping, and the Type column in the list view. Nothing is broken — there is only one type of record to count, so there is nothing to split.
Where the setting is on, all three appear, and the report counts leads and opportunities together in one figure. Converting a lead does not create a second record — it changes the type of the one that exists — so nothing is ever double-counted. Group by Type to see how much of the intake is still sitting unqualified.
Useful groupings
| Source / Medium / Campaign | Where the enquiry came from. The three together are the marketing attribution. |
|---|---|
| Won/Lost | Won, Lost or Pending — the conversion axis. It is not one of the offered groupings; pick it from the Custom Group selector at the foot of the Group By menu. |
| Lost Reason | Why the losses happened, which is where a source analysis usually leads next. |
| Salesperson / Sales Team | Who received the intake. Sales Team is already the pivot's columns. |
| Stage | How far enquiries typically progress. |
| Country / City | Geography, as far as the records are filled in. |
| Creation Date | The time axis, already the pivot's rows and the graph's bars. |
| Closed Date / Expected Closing | The other two date axes, for when you want to count by outcome rather than by arrival. |
How this differs from Pipeline Analysis
| Opens as | Leads Analysis opens as a bar graph of Count. Pipeline Analysis also opens as a graph, but its default measure is Prorated Revenue — revenue already weighted by probability. |
|---|---|
| Archived records | Included here, excluded there. Pipeline Analysis carries no Active or Inactive filter, so it falls back to the default behaviour of hiding archived records — which means it shows open and won deals, and silently drops every lost one. |
| Date filter | Leads Analysis pins the current year on creation date. Pipeline Analysis pins nothing, so it covers the whole history. |
| Views | Leads Analysis offers graph, pivot and list. Pipeline Analysis offers the same three plus the form. |
| Pivot layout | Leads Analysis puts creation months down the side and sales teams across the top. Pipeline Analysis puts stages down the side and creation months across the top. |
Troubleshooting
| The count is higher than the pipeline shows | Lost deals are included here and excluded there. Both are correct for their purpose. |
|---|---|
| Clicking Won changed nothing | It was added to the Active or Inactive facet rather than narrowing it. Remove that facet first, or group by Won/Lost instead. |
| Everything is under one source, or under none | Enquiries are being created without attribution. Those fields fill themselves only when an enquiry arrives through a tracked channel. |
| Nothing before January | The Created on facet is set to the current year. Remove it or widen it. |
| Expected Revenue totals look inflated | They include lost deals, whose revenue was never earned. Group by Won/Lost to separate them. |
| There is no Type column | The Leads stage is not enabled on this system, so every record is an opportunity and the column is hidden. |
Common mistakes
- Reading a raw count as pipeline health. It is intake, losses included.
- Judging channels on volume alone, without splitting the count by Won/Lost.
- Believing the Won filter narrowed the report when it was folded into the facet already there.
- Expecting attribution on enquiries that were typed in by hand.
- Comparing a figure from here with one from Reporting › Pipeline, which starts from a different filter set and a different measure.
Was this article helpful?
Thanks — your feedback helps.
Running a window or door factory?
Ask for a demo