Forecast by expected closing month, weighted by probability
What this does
CRM › Reporting › Forecast lays your opportunities out by the month they are expected to close, with a total above each month. It is the screen that answers "what is likely to land, and when".
One thing about it governs every number you might quote from it: every amount on this board — the figure on each card and the total above each column — has already been multiplied by the deal's probability. The Forecast does not show what the deals are worth. It shows what they are worth after weighting.
Before you start
- The board is built from two fields on each opportunity: Expected Revenue and the probability carried by its stage. A forecast is only as honest as those two.
- The screen opens on your own deals rather than the company's, and on the current month forward. Anything expected to close before this month is filtered out, not missing.
- Only opportunities reach this screen. The action is restricted to
type = opportunity, so a lead never appears here even on a system where the Leads stage is switched on.
Steps
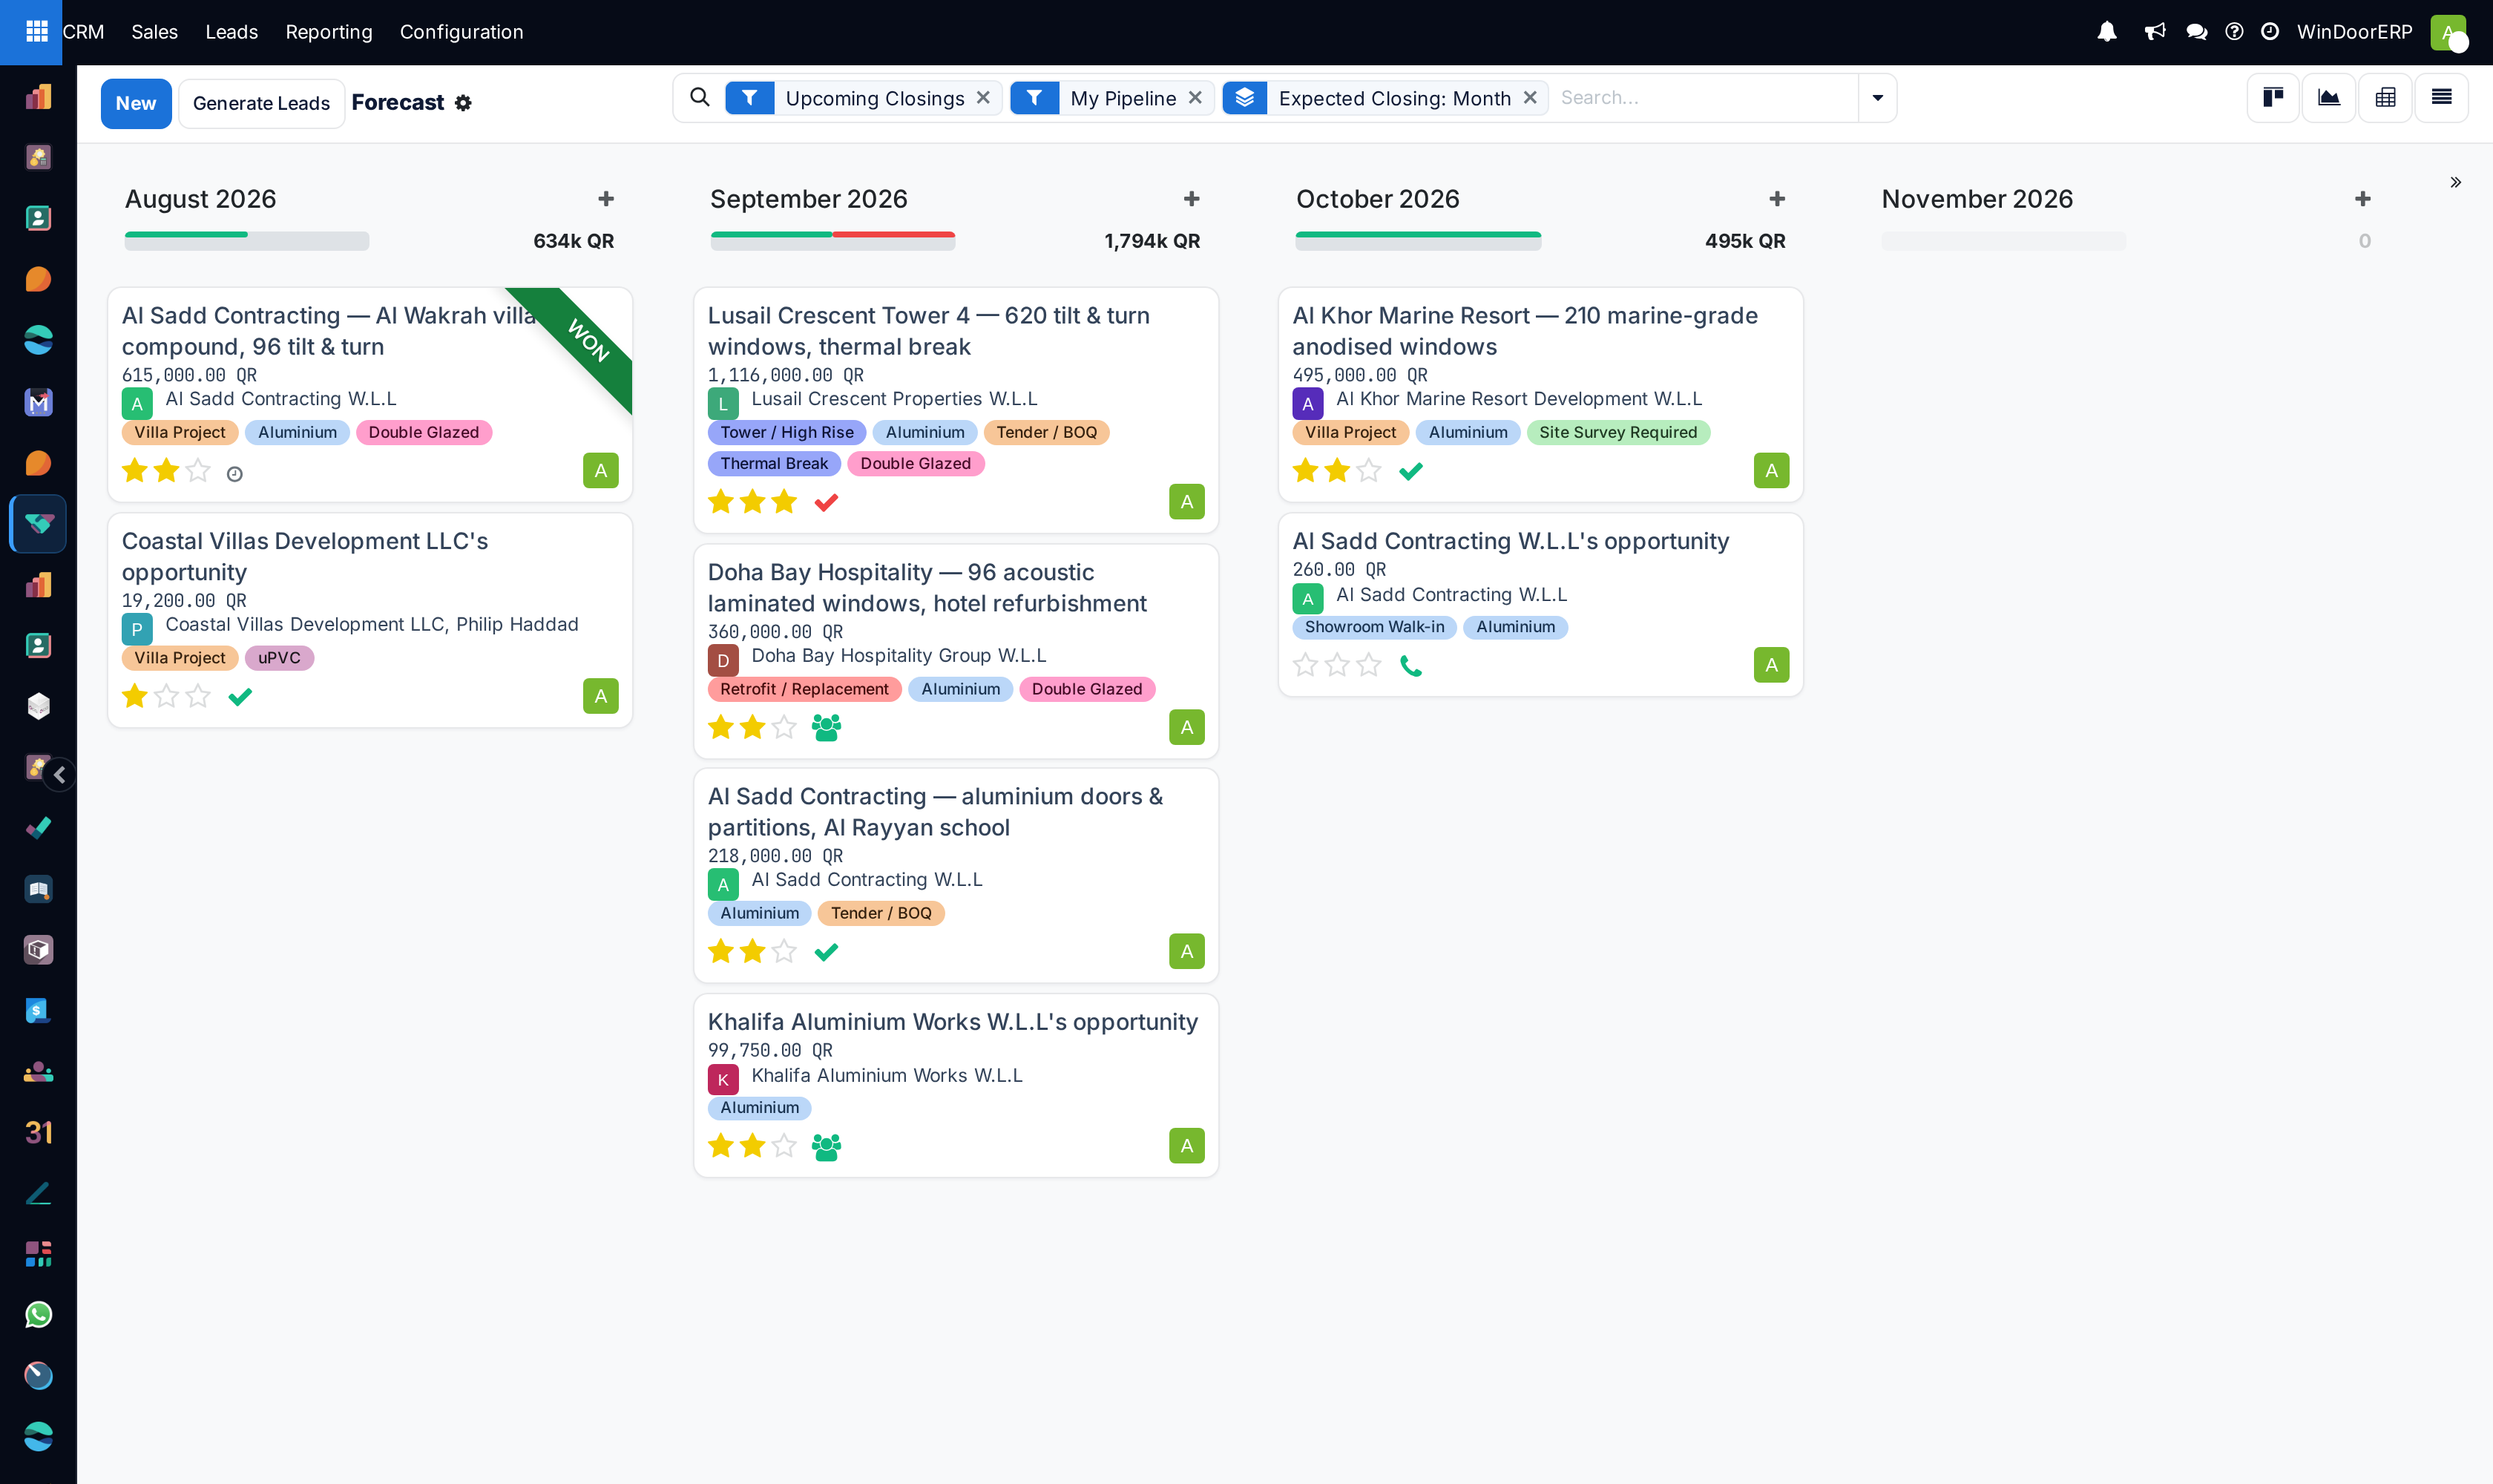
The card amount here is the weighted amount, not the deal's value
Every other CRM screen shows an opportunity's Expected Revenue. The Forecast board replaces it with Prorated Revenue — Expected Revenue × probability ÷ 100 — on the card and in the column total alike.
So one deal reads two different amounts on two screens, and both are correct. Lusail Crescent Tower 4 — 620 tilt & turn windows is a 2,480,000 QR opportunity at 45%: its pipeline card says 2,480,000.00 QR and its forecast card says 1,116,000.00 QR.
The reassuring half is that a column heading and the cards beneath it always agree. In the figure above, September's four cards read 1,116,000 + 360,000 + 218,000 + 99,750 and the heading reads 1,794k QR, which is exactly their sum. If a total ever looks unrelated to its cards, a segment of the progress bar has been clicked and the column is filtered.
-
01
Open CRM › Reporting › Forecast.
-
02
Read the three facets the screen arrives with: Upcoming Closings, My Pipeline and Expected Closing: Month. Remove My Pipeline to see the whole company.
-
03
Read each column heading: the month, and beside the progress bar the weighted total for that month.
-
04
Drag a card into another column to move its expected closing date into that month — the column totals follow immediately.
-
05
Use the folded strip at the end of the board, labelled next month, to add one more month column when you want to plan past the last month that has deals in it.
-
06
Switch to graph, pivot or list with the buttons at the top right when you need the numbers rather than the cards.
What the three facets do
Upcoming Closings sets the board's horizon. It keeps an opportunity whose expected closing date falls on or after the first day of the current month, and it also keeps deals that have no expected closing date at all — those are not discarded, they gather in a column of their own at the end of the board. Remove this facet and every closed-out month in the system comes back with it.
My Pipeline restricts the board to opportunities assigned to you. A manager opening this screen sees their own deals rather than the team's, and the monthly totals are correspondingly small. Remove it for the whole company, or replace it with a grouping by salesperson to compare people's forecasts side by side. This is the single most common reason a forecast "looks wrong".
Expected Closing: Month is a grouping, not a filter — it is what turns the board into months. Group by something else and the screen becomes an ordinary kanban with no forecast behaviour: the month columns, the running totals and the drag-to-reschedule all depend on this grouping being in place.
Reading a column
| Month heading | The expected closing month. A month with no deals in it is still drawn, showing a zero, so a gap in the pipeline is visible rather than hidden. |
|---|---|
| Progress bar | Splits the column by the state of each deal's next activity — green for planned, amber for today, red for overdue, grey for deals with nothing scheduled. Click a segment to keep only those deals; the total beside it follows the filter. |
| Column total | The sum of Prorated Revenue over the column, abbreviated to thousands — 1,794k QR. |
| Card amount | That opportunity's Prorated Revenue: its expected revenue already multiplied by its probability. |
| Stars | Priority, set by hand on the deal. |
| Activity dot | The next activity's type and state. Its colour is what the progress bar counts. |
| Won ribbon | A green Won corner on any deal whose Won/Lost reads Won. Won deals stay in the month they were expected to close, and stay in the total. |
| + in a column heading | Creates a new opportunity already dated into that month. |
Troubleshooting
| The forecast is far smaller than the pipeline | Usually both reasons at once: My Pipeline is still applied, and every figure here is weighted by probability while the pipeline's are not. |
|---|---|
| A deal sits in a column with no month on it | It has no expected closing date. Set one on the deal, or drag the card into a month column. |
| Nothing before this month | Upcoming Closings cuts the board off at the first of the current month. Remove the facet to see history. |
| The totals never move | Probabilities are not being maintained. Every number on this screen is driven by them. |
| Everything sits in one month | Expected closing dates are being left where they landed rather than set to a realistic date. |
| A won deal is still counted | Won deals remain in their expected month. Group by Won/Lost to separate them, or use the pipeline for a live view. |
Common mistakes
- Quoting a forecast figure as the value of the deals. It is their weighted value; the unweighted one is on the pipeline.
- Reviewing a team's forecast without removing My Pipeline.
- Leaving probabilities at their stage default and then treating the forecast as a commitment.
- Reading a column total while a progress-bar segment is selected, which filters the column and the total with it.
Was this article helpful?
Thanks — your feedback helps.
Running a window or door factory?
Ask for a demo