Analyse stock moves and their values
What this does
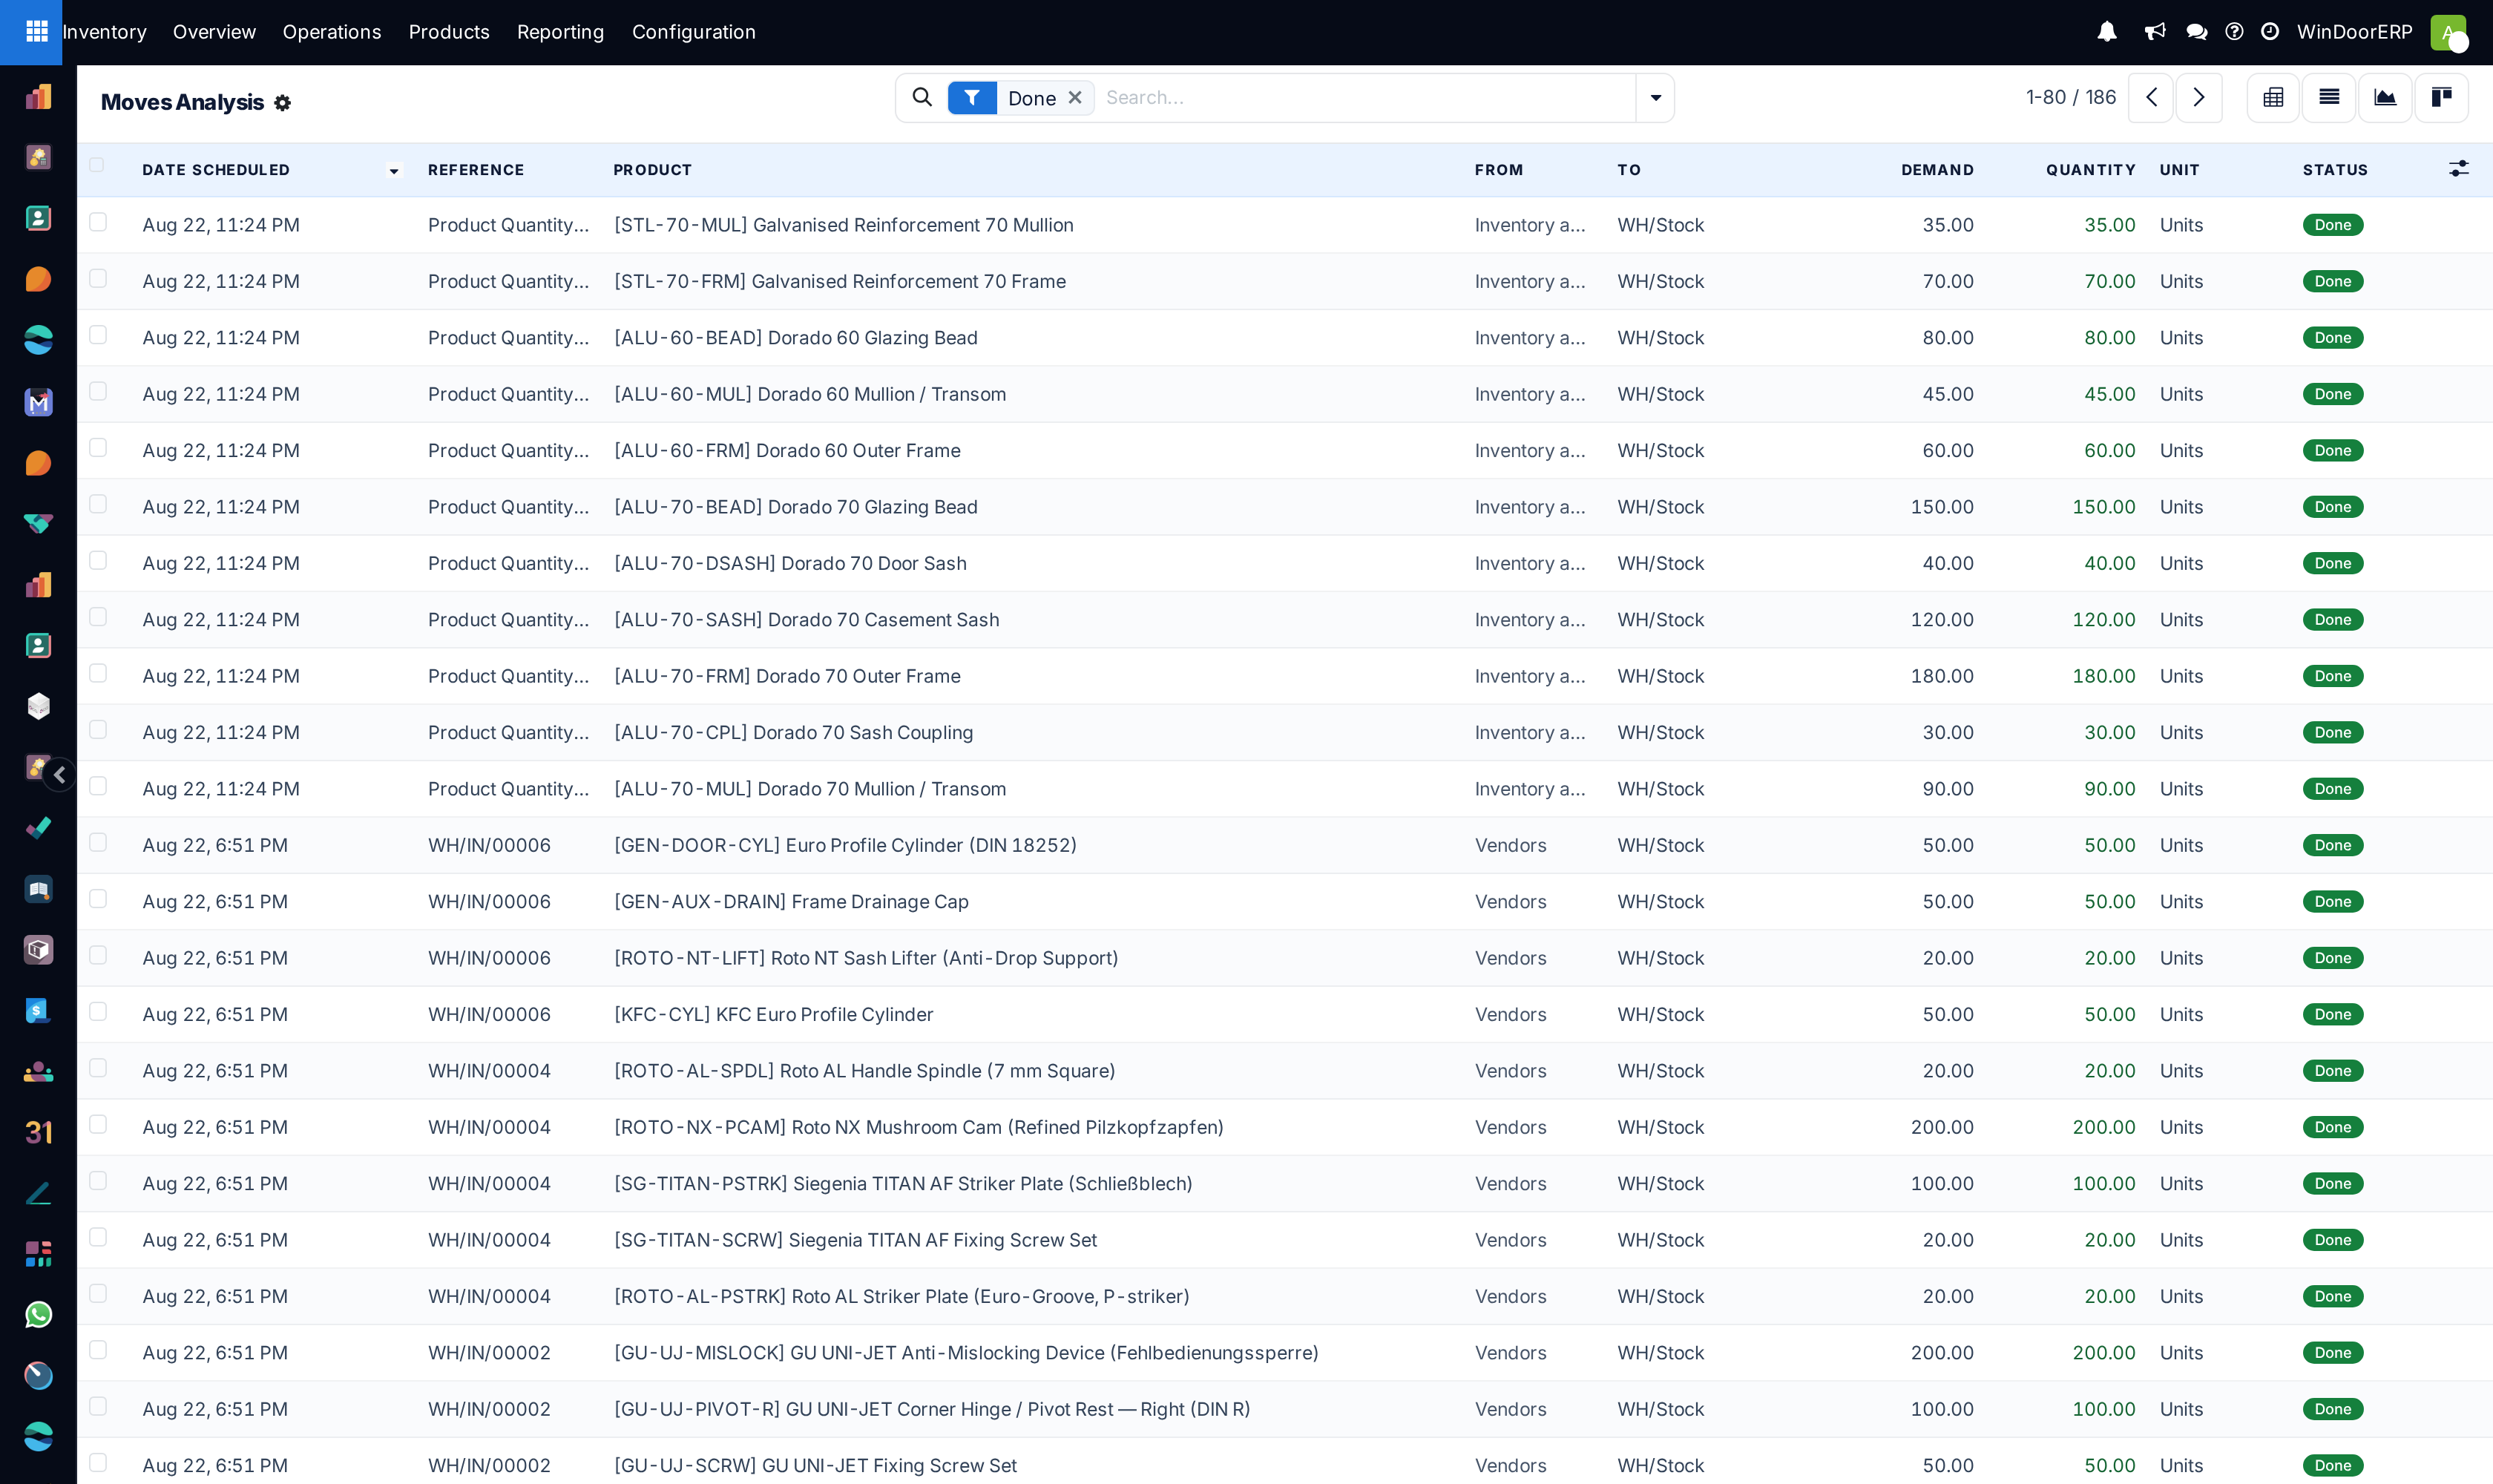
Moves Analysis is the planning-level list of stock moves: one row for every move WindoorERP created, showing what was asked for against what actually moved and — uniquely among the reporting screens — what that move was worth. Use it when the question is about consumption, throughput or cost rather than about tracing one product's history.
See also
To follow a single product's journey through the warehouse use Trace every movement of a product, which covers Moves History — one row per physical movement of units, with a pivot view and a click-through to the document behind each line.
Before you start
- The whole Reporting menu is reserved for the Administrator access level in Inventory. A colleague on the User level works transfers and scraps but has no reporting menu at all, so this screen cannot simply be shown to them.
- Know which of the two move reports you want. Moves History is one row per move line — what physically went from where to where, and when. Moves Analysis is one row per stock move, carrying the request and the result together, plus the value columns.
- The screen opens filtered to Done and cannot create anything. That is deliberate: moves are produced by transfers, scraps and count adjustments, never typed into a report.
Steps
-
01
Open Inventory › Reporting › Moves Analysis.
-
02
Leave the Done filter in place for historical figures, or swap it for Ready or To Do to look at what is still coming.
-
03
Open the optional-column picker at the end of the header row and switch on Value. It is hidden by default and it is the reason to be on this screen rather than on Moves History.
-
04
Group by Product, Operation Type, Picking, Status or Scheduled Date to compare flows and periods.
-
05
Read Demand against Quantity to find where the two diverge — a short pick, a partial receipt, or a delivery that went out heavier than it was ordered.
The columns
Nine columns are on screen by default and three more are waiting in the optional-column picker. Everything here is read-only: clicking a row puts it into inline edit, but every cell refuses the edit, and there is no link through to the transfer behind it — that link lives on Moves History.
| Column | What it tells you |
|---|---|
| Date Scheduled | When the move is due, or when it happened. It turns red when the date has passed and the move is neither done nor cancelled. |
| Reference | The document the move belongs to — WH/IN/00004 for a receipt, SP/00002 for a scrap, the adjustment's own name for a count. Type a fragment of it into the search box to pull one document's moves together. |
| Product | The product, shown with its internal reference in brackets. |
| From / To | Source and destination location. Anything outside your own stock — Vendors, Customers, Inventory adjustment — is greyed out, so a row with one grey end is stock entering or leaving the company. |
| Demand | What the move asked for, totalled at the foot of the list as Total Demand. |
| Quantity | What actually moved, totalled as Total Quantity. Red when the units left your stock, green when they entered it. A gap against Demand is the interesting number. |
| Unit | The unit of measure the move was recorded in. |
| Status | New, Waiting Another Move, Waiting, Partially Available, Available, Done or Cancelled. The search filters use friendlier names: Ready means Available, and To Do gathers Waiting, Waiting Another Move and Available together. |
| Value (hidden) | What the move was worth. No other reporting screen offers it. Read the next section before you quote it. |
| Remaining Quantity (hidden) | How much of an incoming move has not yet been consumed by later outgoing moves. Only incoming moves carry it. |
| Remaining Value (hidden) | What that untouched remainder is worth. With the standard costing this platform uses, it is the remaining quantity times the product's current Cost. |
What Value actually means here
A move is only valued when it is Done and it crosses the boundary of your own stock. Receipts and deliveries are valued; an internal transfer between two of your own locations is not, and neither is anything still in progress — those rows show 0.00, and that zero is not a data problem.
For the moves that are valued, WindoorERP builds the figure in a fixed order of preference and stops at the first source that can answer: a manual valuation adjustment recorded against that move, then the vendor bill or customer invoice that covers it, then the purchase or sales order line, then the original of a return, and only then the product's own Cost. Because every product category on this platform is on Standard costing, most moves land on that last rule and the Value is simply quantity times cost — but a receipt that has already been billed shows what the bill said, not what the product card says.
Important
This column is not an accounting ledger. Inventory valuation on this platform is periodic, so no journal entry is posted when a move is validated — the value you read here is the move's own computed worth, and the general ledger only learns about it at a stock closing. Treat the total as an operational figure and reconcile with Accounting before it goes in a report.
Filters and groupings that exist
The filter and group-by lists on this screen are shorter than they look elsewhere, because several entries only appear when Storage Locations or developer mode is switched on, and neither is on here.
| Where | What is offered |
|---|---|
| Search fields | Product, and Reference — which searches the move's reference, its source document and its transfer at once — and Partner. The location search fields need Storage Locations. |
| Filters | Ready, To Do, Done (applied by default), Incoming, Outgoing, Inventory, a Date period picker, and Remaining, which keeps only moves that still have an unconsumed remainder. |
| Group By | Product, Operation Type, Picking, Status and Scheduled Date. Source and Destination Location need Storage Locations; Creation Date needs developer mode. |
Note
There is no product-category grouping here, and no pivot or graph button — this action offers a list and a form and nothing else. When you need to cross-tabulate quantities by category and month, use the pivot on Moves History instead and accept that it carries no value column. The two screens each hold half of what a full analysis wants.
Where scrap and production show up
The Inventory filter selects count adjustments only; a scrap is not flagged that way. Validated scrap arrives here as an ordinary outgoing move to the inventory-loss location, with its SP/ reference in the Reference column — and, because it leaves your stock, it is valued. Searching the Reference for SP/ with the Value column switched on is the only place on this platform that answers "what did the waste cost", and it is worth knowing because no scrap screen reports value at all.
Fabricated work reaches this screen the same ordinary way: profile, glass and hardware leaving stock, finished units arriving. So a month's material consumption is readable here, but it is consumption of materials, not a production report — how production consumes and produces stock is documented in Launch production from a sales order.
Correcting a value
Select exactly one row, open Actions and choose Adjust Valuation. A dialog opens showing the Current Value with the per-unit breakdown beside it, an explanation of where that figure came from, and a New Value box with a Description for the reason. Saving records a manual valuation that then outranks every other source for that move.
Select two rows and the action refuses with "You can only adjust valuation for one move at a time." The dialog is also Administrator-only, like the rest of this menu.
Troubleshooting
| Symptom | Cause and fix |
|---|---|
| There is no Reporting menu | The account is on the Inventory User access level. Reporting needs Administrator. |
| There is no pivot or graph button | Correct — this screen has neither. Use Moves History for the pivot. |
| No Value column | It is hidden by default. Switch it on from the optional-column picker at the end of the header row. |
| Value shows 0.00 on rows that clearly moved something | The move is an internal transfer, or it is not Done. Only completed moves in or out of your stock are valued. |
| Totals look too low | The default Done filter excludes everything not yet completed. Clear it if you want the pipeline too. |
| You cannot create a move here | By design. Create the transfer, scrap or count instead and the move follows. |
| Clicking a row does not open the transfer | Also by design — this list has no click-through. Copy the Reference and search it in Transfers, or use Moves History. |
| No Source Location column or grouping | Those need Storage Locations, which is off on this platform. The From and To columns still show the locations. |
| The screen is empty | Nothing has been validated yet. A brand-new database has no done moves, so the default filter leaves nothing on screen. |
Common mistakes
- Mixing draft and done moves into one "consumption" figure by clearing the Done filter without noticing.
- Reading Demand as what happened. Demand is the request; Quantity is the fact.
- Quoting the Value total as an accounting number. It is a computed operational value, not a posted one.
- Looking for value on Moves History, which has no value column, and concluding the data is missing.
- Assuming a zero Value means a costing problem when the move is simply internal or unfinished.
Was this article helpful?
Thanks — your feedback helps.
Running a window or door factory?
Ask for a demo