Read the five reports
Put the warehouse on a dashboard
Why this step
The last step turns the four reports above into something looked at weekly rather than requested annually. A dashboard somebody glances at beats a report nobody runs.
What this does
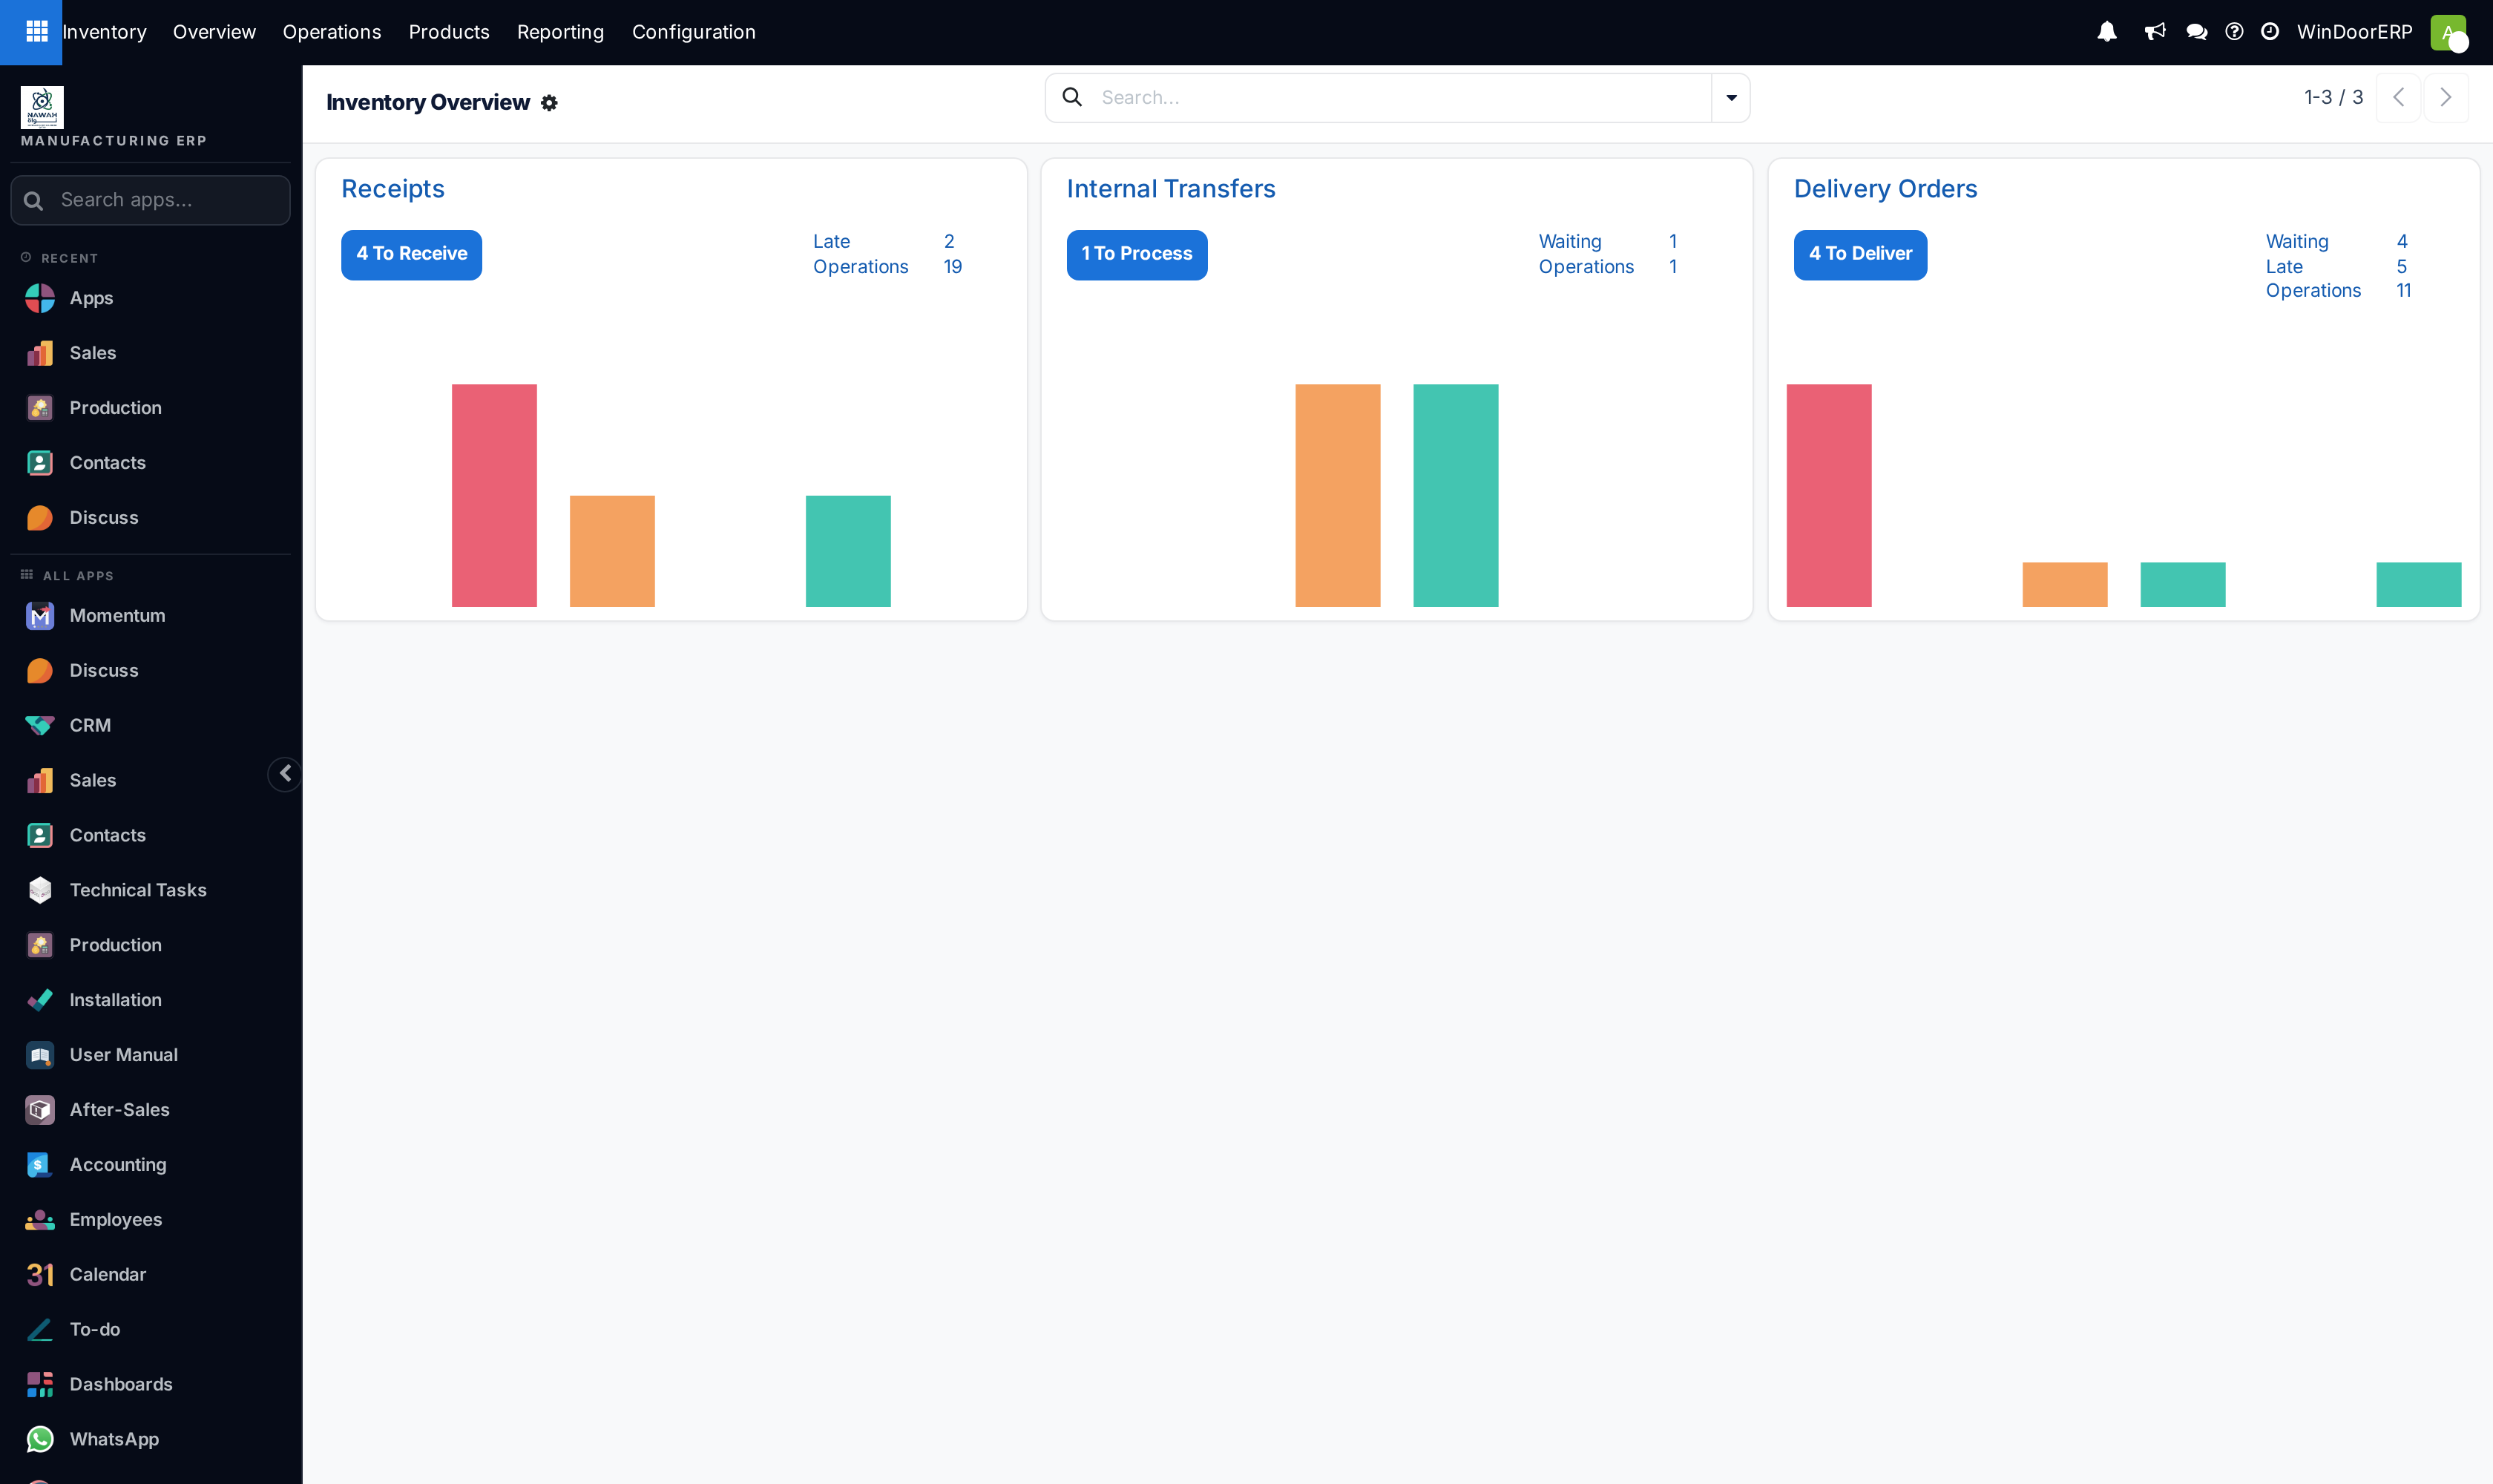
Two screens watch the warehouse for you, answering different questions. The Inventory Overview — the Inventory app's landing page — is the operational pulse: one card per operation type with what is ready, waiting, late and backordered, refreshed as work moves. The Warehouse Metrics board in the Dashboards app is the stock-health view: reserved-stock shares, negative-stock lines, and quantity/value breakdowns by location.
That is the complete set on this platform — one operations screen, one metrics board. If other documentation promises additional warehouse dashboards, they are not part of this installation.
Before you start
- The Overview is open to every inventory user; Warehouse Metrics shows only for Inventory Managers.
- The numbers are only as live as validation discipline — a transfer nobody validates stays "ready" forever and never turns late honestly.
Steps
-
01
Open Inventory — the Overview is the first screen: one card each for Receipts, Internal Transfers and Delivery Orders.
-
02
Read each card's main button — N To Receive / N To Process / N To Deliver — the transfers ready to run; it opens them. (At zero it reads simply Open.)
-
03
Scan the side counters, each a click-through and each shown only when non-zero: Waiting (blocked on availability or another operation), Late (open transfers scheduled before today or past their deadline), Back Orders, and Operations (ready product moves).
-
04
Read the card's bar graph — transfers per day around today — for the week's shape at a glance.
-
05
Use the card's ⋮ menu for shortcuts: all/ready/waiting transfers, a New blank transfer, and this type's Reporting (its Moves Analysis). Managers additionally get the colour picker, the favourite star and the operation type's configuration.
-
06
For stock health, open Dashboards › Logistics › Warehouse Metrics: the reserved-share scorecards (quantity and value), the negative-stock line count with its top-10 carousel, and the available-versus-reserved breakdowns — filterable by warehouse, location, category and product.
What the counters actually count
| Counter | Definition |
|---|---|
| To Receive / To Process / To Deliver | Transfers of this type in the Ready state — reservations satisfied, work can start now. |
| Waiting | Transfers confirmed but blocked — stock not available, or waiting on another operation. |
| Late | Open transfers whose scheduled date is before today, or with a deadline problem — the firefighting list. |
| Back Orders | Open backorders of this type — the residue of partial processing. |
| Operations | Ready product moves (line-level), a finer count than transfers. |
Note
The Overview shows no money — it is an operations screen. Value questions belong to the Stock report and the Warehouse Metrics board; how that board behaves as a dashboard (filters, drill-through, sharing, its sample data when stock is empty) is covered in the Dashboards-app article.
Troubleshooting
| A counter is missing from a card | Counters render only when non-zero — an absent Late is good news, not a bug. |
|---|---|
| The Late count won't go down | It counts open transfers past their scheduled date: validate them, reschedule them, or cancel them — ignoring them keeps them late forever. |
| Warehouse Metrics is missing from Dashboards | It is gated to Inventory Managers — without that role the board is not listed for you. |
| Warehouse Metrics shows plausible data that isn't ours | Its built-in sample renders while there is no stock data. It disappears with real quants. |
| Overview cards for operation types we don't use | Each card is an operation type of the warehouse; archive unused types in their configuration rather than living with dead cards. |
Common mistakes
- Reading the ready-count button as a workload total — it is what can start now; Waiting and Back Orders carry the rest.
- Treating the bar graph as history for analysis — it is a glance widget; real analysis lives in Moves History's pivot.
- Chasing warehouse "performance KPIs" here — cycle times and volumes come from the reporting screens; the Overview is a to-do radar.
- Letting late transfers age because the overview "still works" — every stale ready transfer degrades the reservation picture everywhere else.
Checkpoint
One screen shows stock value, aging and movement, and somebody actually looks at it.