Read the five reports
Find the stock that stopped moving
Why this step
Start here if you only read one. Profile in a finish you no longer sell, ordered for a job that was cancelled, is the quiet way a fenestration company loses money — and aging is the only report that shows it before a stock write-off does.
What this does
Inventory › Reporting › Stock Aging Report answers "how long has this stock been sitting here" — and therefore where working capital is quietly parked. A filter dialog generates a banded breakdown of current stock: quantities or values split into age periods (30 / 60 / 90 / 180 / 365 days by default), per product, category, location or lot, with slow-moving flags and a turnover-risk rating per row, in list, pivot and graph views or as a PDF.
Age is counted from the first receipt of that product into that location, against current on-hand stock. It is a "what is sitting here now, and since when" report — not a historical reconstruction.
Before you start
- The Inventory Manager role — the Reporting menu gates the entry.
- Value figures are quantity × the product's Cost, consistent with this platform's standard costing — maintained costs, honest values.
Steps
-
01
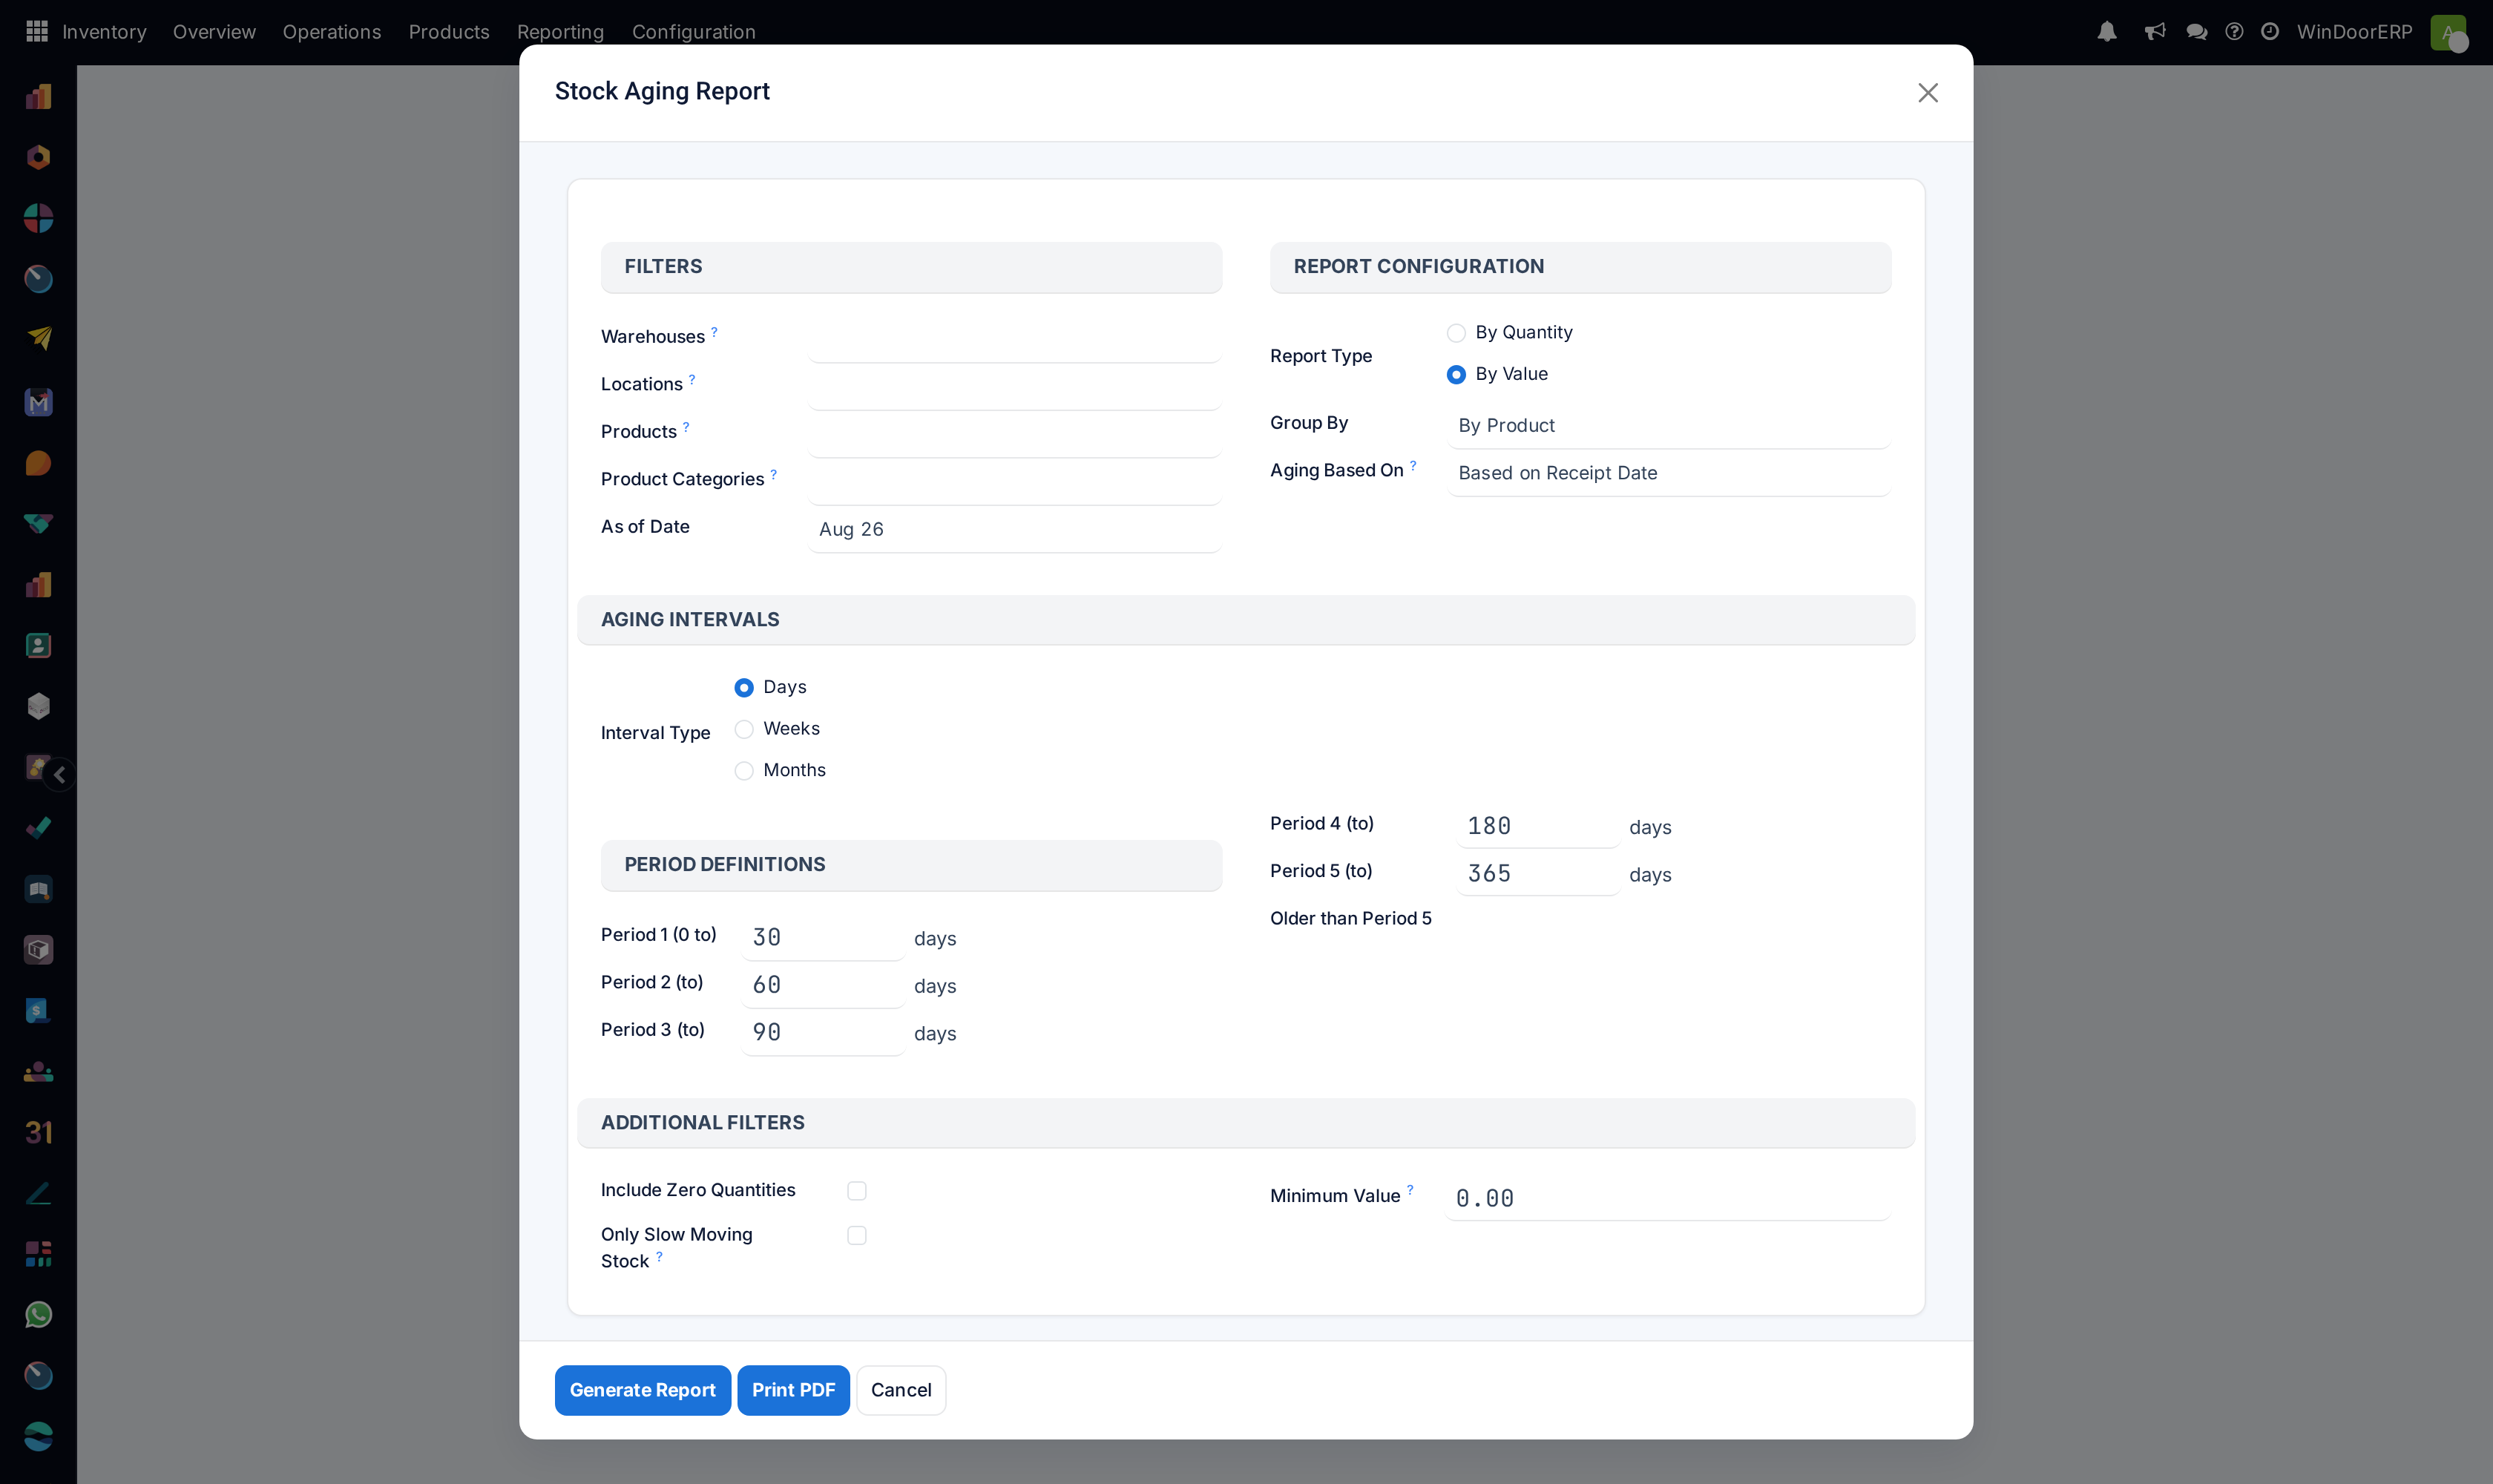
Open Inventory › Reporting › Stock Aging Report. The filter dialog opens.
-
02
Scope it: Warehouses, Locations, Products or Product Categories — empty means everything — and the As of Date.
-
03
Pick the Report Type — By Value (default, the working-capital view) or By Quantity — and the Group By: product, category, location or lot.
-
04
Set the Aging Intervals if the defaults don't fit: interval type Days / Weeks / Months, with five editable period bounds.
-
05
Optionally tick Only Slow Moving Stock — it keeps rows carrying stock in Period 3 or beyond, i.e. older than the Period 2 bound (60 days with the defaults) — or set a Minimum Value to cut noise.
-
06
Press Generate Report for the interactive result — or Print PDF for the same thing as a document.
-
07
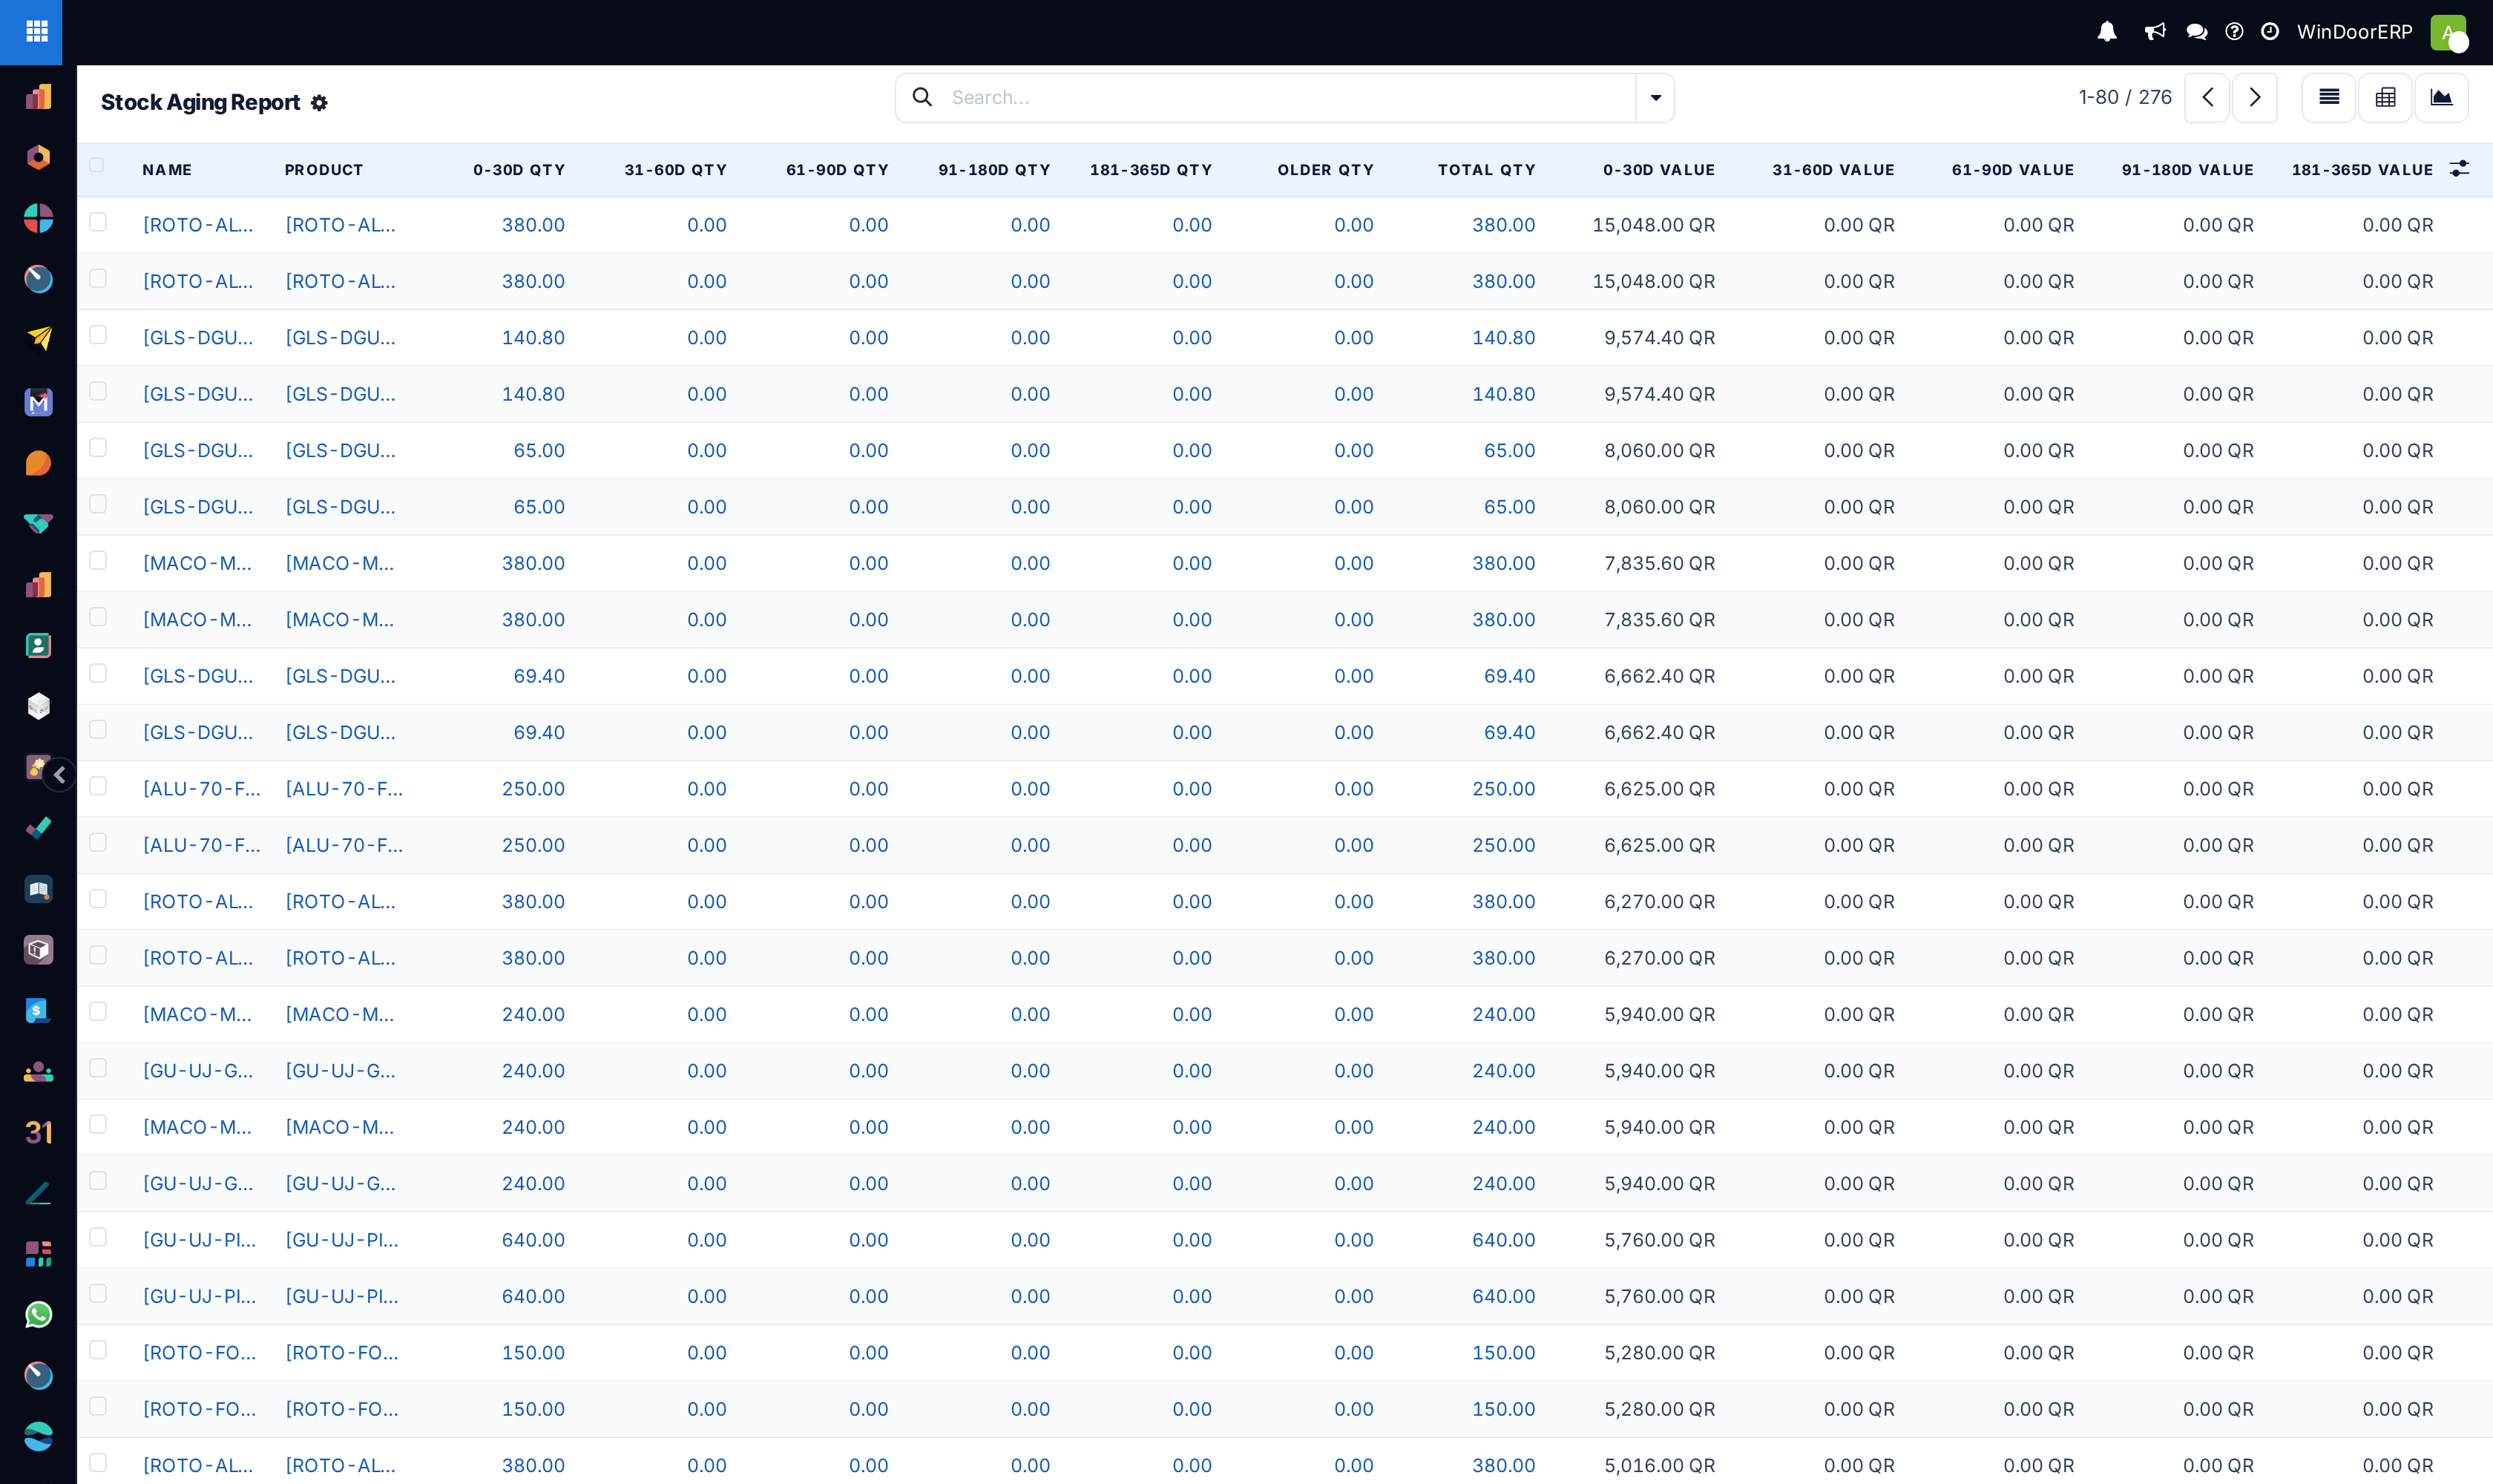
In the result, sort by the older bands or the Turnover Risk badge, and use a row's View Moves button to see the receipts behind its age.
Reading the result
| Column / element | Meaning |
|---|---|
| The band columns | Quantity (or value) per age band, plus Older and Total, each with column sums. The headers always read 0-30d / 31-60d / 61-90d / 91-180d / 181-365d — they do not re-label when you customise the intervals; your custom bounds still drive the bucketing, only the captions stay fixed. |
| Slow Moving | Flagged when more than half the row's quantity sits in Period 3 or older. |
| Avg Age (Days) | A weighted estimate using each band's midpoint. |
| Turnover Risk | Low / Medium / High / Critical as the share in the oldest bands passes 25 / 50 / 75%. |
| Row buttons | View Moves — the done move lines for the row's product and location; View Product. |
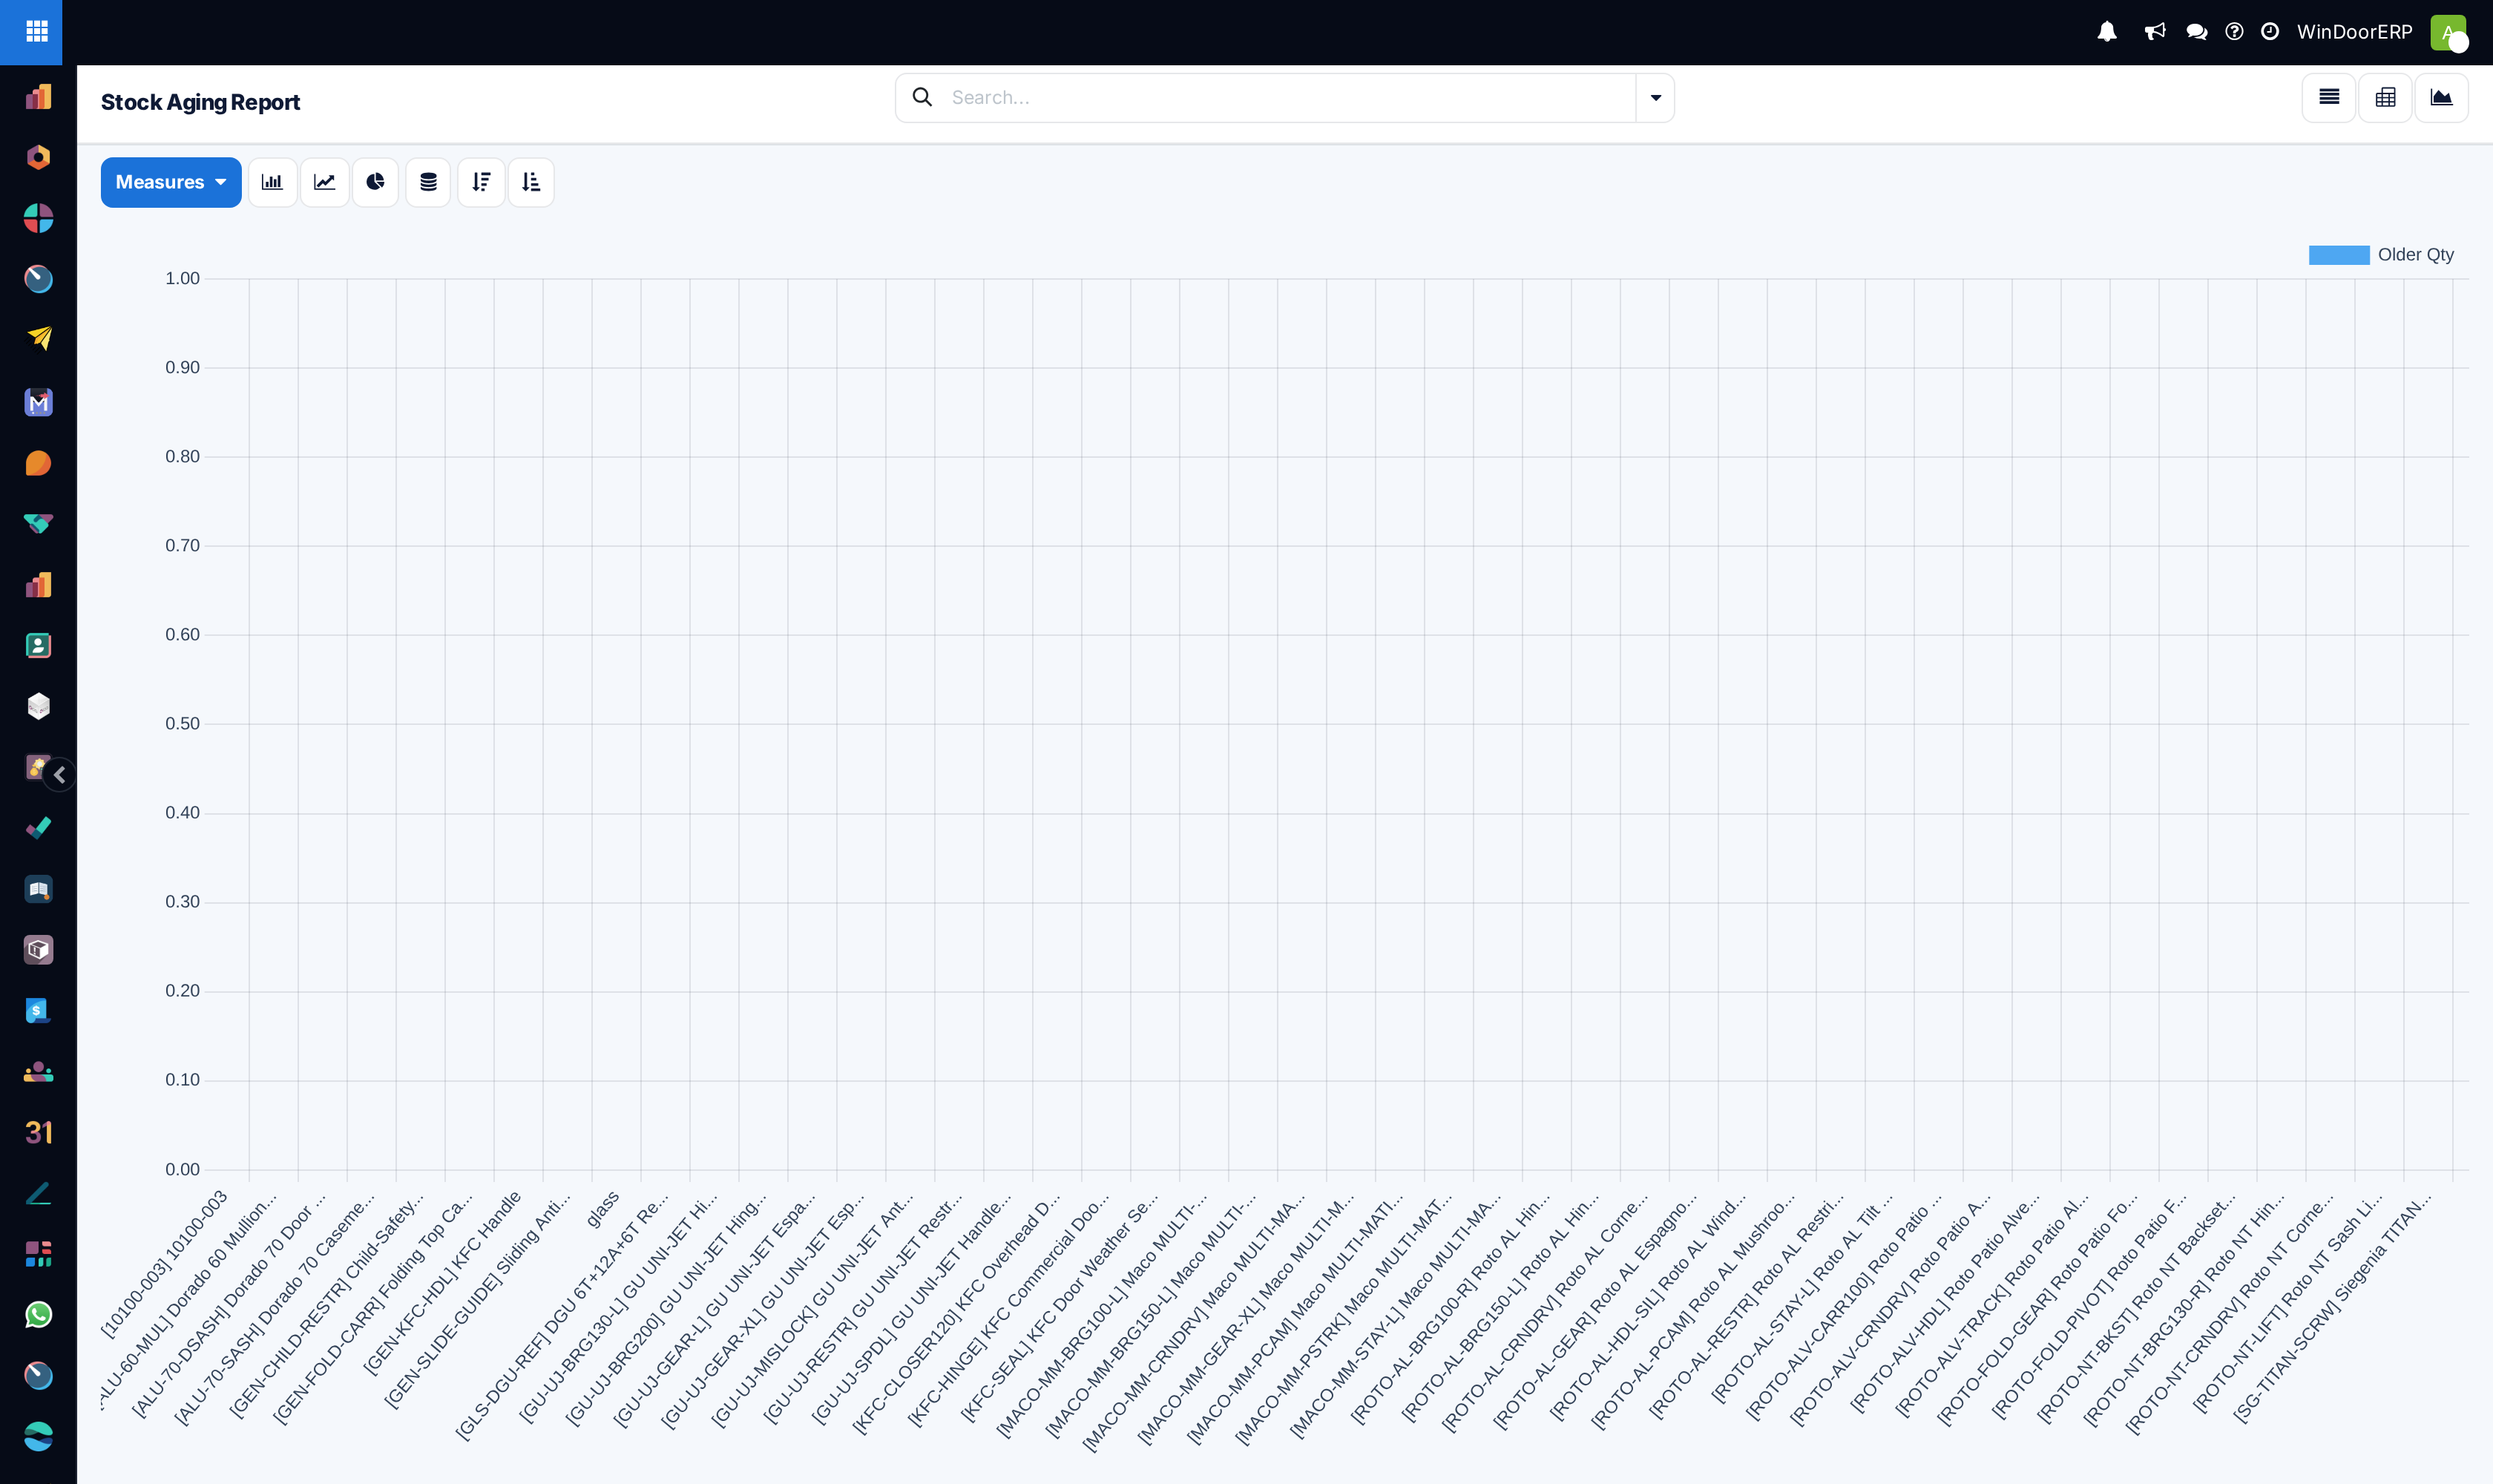
| Views | List (risk-coloured rows), pivot (bands as measures, rows by category) and a stacked bar graph. One search filter exists: Has Stock > 90 Days. |
How the ages are computed — the honest details
- Current stock only. The report buckets what is on hand now; the As of Date shifts the age arithmetic, it does not reconstruct past stock levels.
- First receipt, not remaining receipts. A location's stock ages from the first time that product ever arrived there — a rack continuously topped up still ages from its first delivery, which makes fast-turning stock look older than a strict FIFO reading would. Read the older bands as "this rack has held this product that long", and use View Moves before condemning material.
- Results are personal and temporary. Each Generate replaces your previous result; two managers can generate different scopes without collision, and nothing here is stored for posterity — regenerate rather than bookmark.
- Leave "Aging Based On" on Receipt Date. The Manufacturing Date alternative depends on an expiry field this platform does not have — with lot-carrying stock it errors, and otherwise it behaves identically to receipt date. It is not usable here.
Troubleshooting
| Generate Report opens an empty list | Nothing matched the scope — there is no message for this case. Widen the filters; for zero-stock rows tick Include Zero Quantities. |
|---|---|
| "No Data / No data found for the selected criteria." | The PDF's version of the same situation. |
| The band headers don't match my custom intervals | Known display limitation — captions are fixed; the bucketing follows your bounds. Note your intervals on whatever you export. |
| Value columns are all zero | Report Type is By Quantity — switch to By Value. (Minimum Value also only applies to the value variant.) |
| Yesterday's result vanished | Results are per-user and wiped by the next Generate. Print the PDF when you need to keep one. |
| An error mentions a missing field when generating | You picked Based on Manufacturing Date with lot-carrying stock — switch back to Receipt Date. |
Common mistakes
- Reading old bands as dead stock without checking View Moves — continuous replenishment ages a location's stock from its first-ever receipt.
- Customising intervals and then reading the fixed column captions literally.
- Running By Quantity to talk about money — the working-capital argument needs By Value.
- Comparing two people's results as if they were one report — each ran their own scope.
- Using the report as an expiry tracker. Nothing here knows shelf life; it measures sitting time, not freshness.
Checkpoint
You can name the oldest material in your yard and say what it is still doing there.